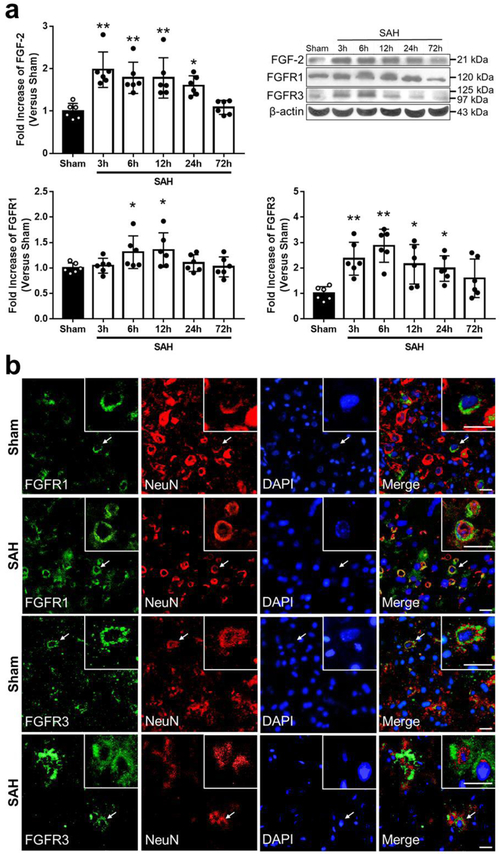
Fig. 1. Expression of endogenous fibroblast growth factor (FGF)-2, FGF receptor (FGFR) 1, and FGFR3.
a Representative western blot images and densitometric quantification of time-dependent expression of FGF-2, FGFR1, and FGFR3 after subarachnoid hemorrhage (SAH). Expression levels of each protein are expressed as a ratio of β-actin levels for normalization and as mean ± standard deviation. *P < 0.05 and ** P < 0.01 vs. Sham group (n = 6 per group). b Colocalization of FGFR1 and FGFR3 with Neuron-specific nuclear protein (NeuN) in the left temporal cerebral cortex at 24 h after modeling. Nuclei are stained with DAPI. Scale Bar = 20 μm (n = 4 per group).

