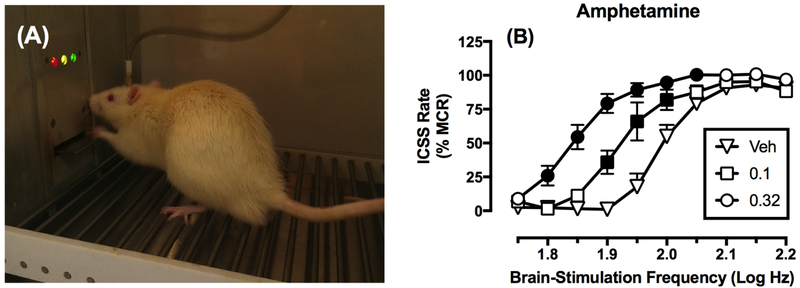
Figure 1. Overview of ICSS procedure.
Panel A shows a male Sprague-Dawley rat in an operant conditioning chamber pressing a lever for electrical brain stimulation. Stimulation is delivered via a microelectrode that is implanted in the medial forebrain bundle and attached by a cable to an ICSS stimulator located outside the frame of the photograph. Panel B shows representative data collected using a “frequency-rate” ICSS procedure, in which brain-stimulation frequency is varied during daily behavioral sessions, and rates of responding are monitored during availability of each frequency. Drugs with abuse liability (e.g. amphetamine) typically produce leftward/upward shifts in ICSS frequency-rate curves across some range of doses. Abscissa: Log brain-stimulation frequency in Hz. Ordinate: ICSS response rate expressed as % Maximum Control Rate (%MCR), a transformation that normalizes data in each rat on each test day to maximum rates during baseline sessions. Filled points show rates significantly different from those after Vehicle (Veh) administration (p<0.05). All points show mean ± SEM from n=6 rats. Data adapted from Bauer et al. (2013).

