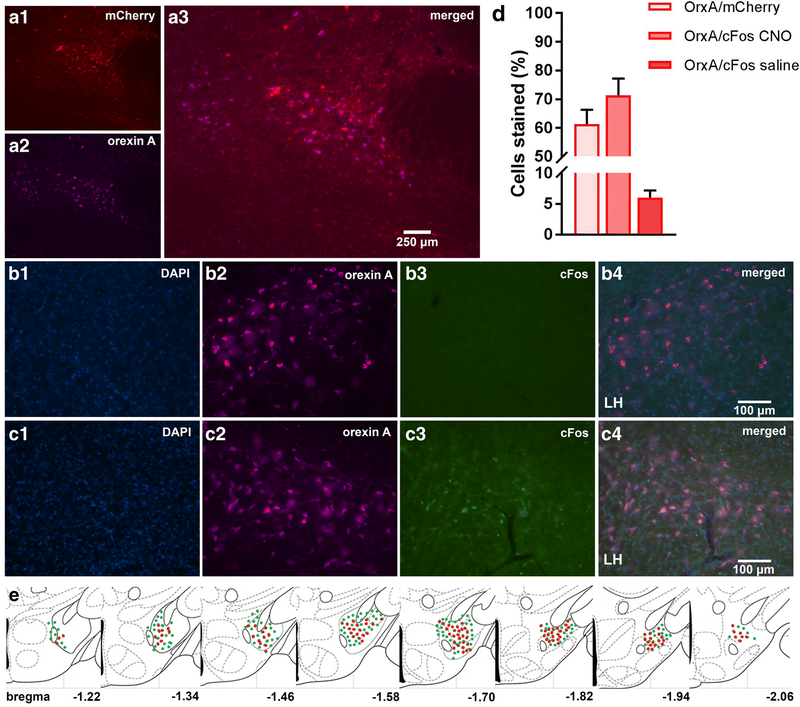
Figure 8:
DREADD expression and functionality confirmation. Representative images displaying viral expression of DREADDs in the LH (A). mCherry positive neurons in red (A1), orexin A positive neurons in purple (A2), and merged images (A3). Representative images displaying c-Fos (early gene) expression. The LH of excitatory DREADD animals were treated with CNO 90 min prior to perfusion (B) and excitatory DREADD animals were treated with saline 90 min prior to perfusion (C). DAPI is shown in blue, orexin A is shown in purple, c-Fos in green, and then the merged images. The number of OrxA/mCherry and OrxA/c-Fos colocalized cells (D). Schematic drawings displaying the spread of viral expression along the LH; green orexin A expressing cells, red mCherry expressing cells (E). (n=5/group)

