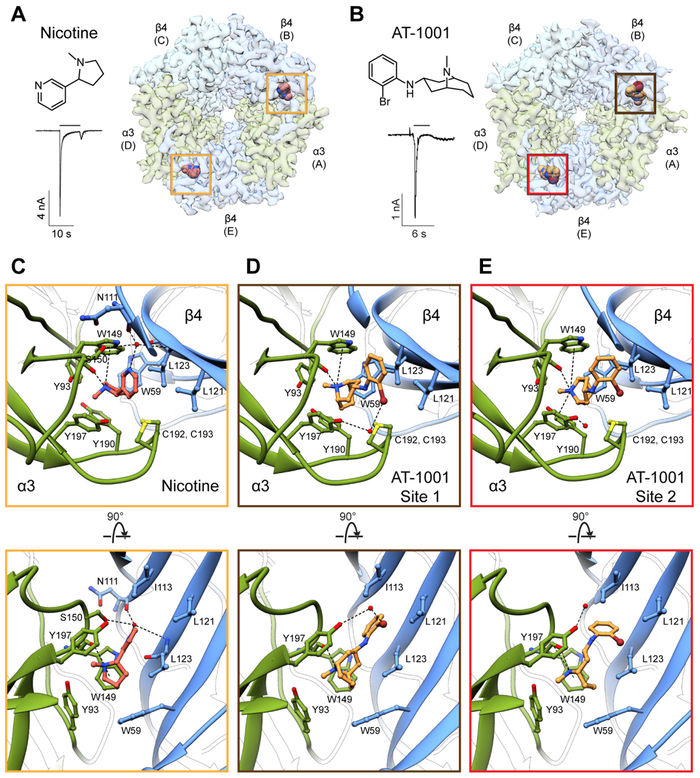
Fig. 3. Ligand-binding sites.
(A) Structure of nicotine, whole-cell response to 1 mM nicotine (concentration used for EM sample preparation), and top view of the α3β4-nicotine complex. Yellow boxes indicate nicotine binding sites. (B) Structure of AT-1001, whole-cell response to 50 μM (concentration used for EM sample preparation), and top view of the α3β4-AT-1001 complex. The brown box indicates site 1 and the red box indicates site 2. (C) Top and side views of nicotine binding site. For clarity, loop C has been removed in the side view. Putative hydrogen bonding and cation–π interactions are represented as dashed lines. (D) Top and side view of binding site 1 for AT-1001. (E) Top and side views for binding site 2 for AT-1001.

