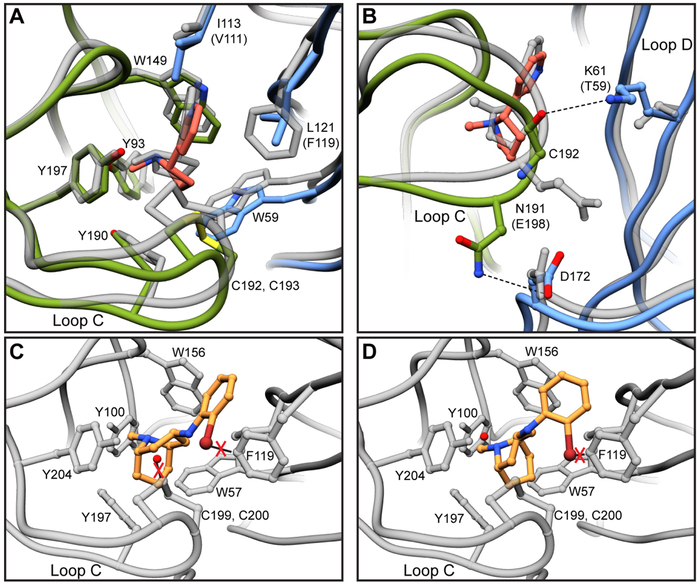
Fig. 4. Comparisons of α3β4 and α4β2 binding pockets.
(A) Overlay of α3β4 and α4β2 binding sites. α4β2 structure is shown in gray. Residue numbering is for α3β4 and substitutions between subtypes are indicated in parentheses. (B) Hydrogen bonds between α3 and β4 that may account for differential loop C structures and corresponding residues in α4β2. (C) Overlay of AT-1001 site 1 orientation in α4β2 binding site. Potential clashes are indicated with red X’s. (D) Overlay of AT-1001 site 2 orientation in α4β2 binding site.
See also Figures S5 and S6.

