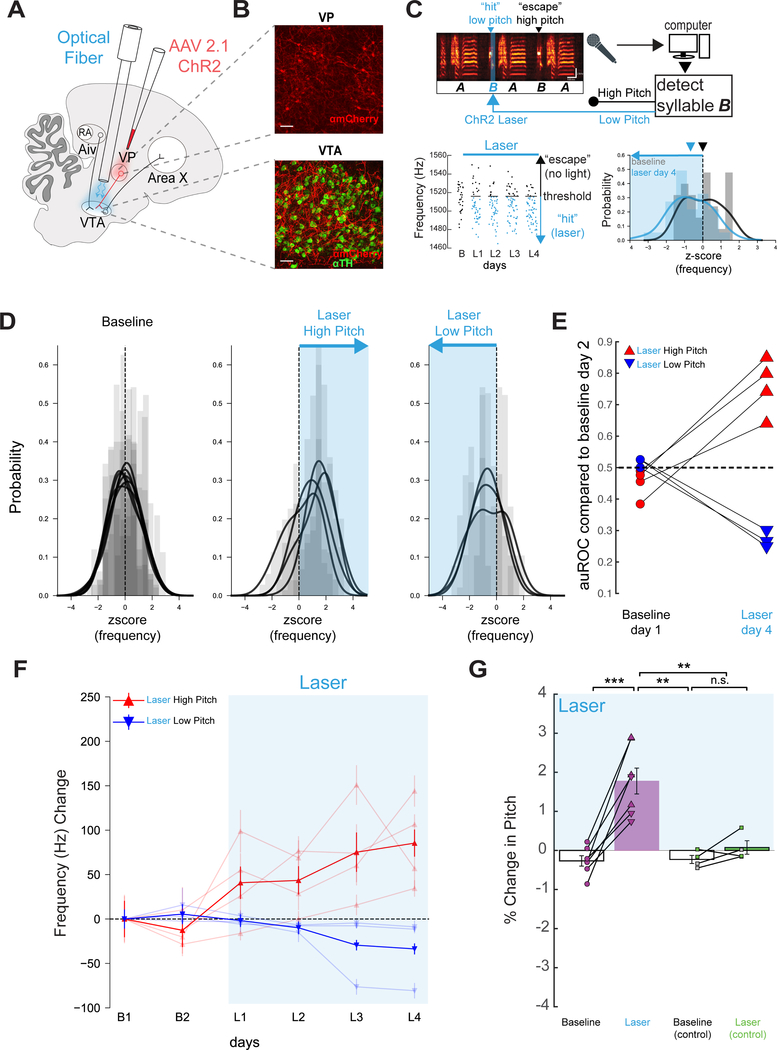
Figure 5: Pitch-contingent activation of VPVTA terminals positively reinforces target syllable pitch.
(A) Viral targeting and stimulation strategy. (B) Top, ChR2 (red) expression in VP. Bottom, VP terminals in VTA (TH+ cells, green). Scale bars: 50 μm. (C) Top, schematic of experimental design. Left, pitch of the target syllable at baseline and on each day of laser stimulation (convention as in Figure 4). Right, z-scored pitch distribution of a target syllable before and after stimulation on low pitch renditions. (D) Left, baseline z-scored pitch distributions from all target syllables. Each histogram represents one syllable. Middle, z-scored pitch distributions from target syllables after stimulation on high pitch variants. Right, as in middle but for stimulation on low pitch variants. (E) auROC for all target syllables on B1 or L4 compared to B2 (n=7 syllables, 6 birds). (F) Change in frequency (hertz) for two baseline days and four days of VPVTA stimulation for syllables targeted on low pitches (n=3, blue, bold line is average across syllables) and high pitch renditions (n=4, red, bold line is average across syllables). (G) Mean percent change in pitch on B1 and L4, relative to B2, in experimental birds (n=7 syllables, n=6 birds, p=0.0006 paired t test). Right, same but in control birds (n=4 syllables, n=4 birds, p=0.2017, paired t test, green: GFP, gray: uninjected).

