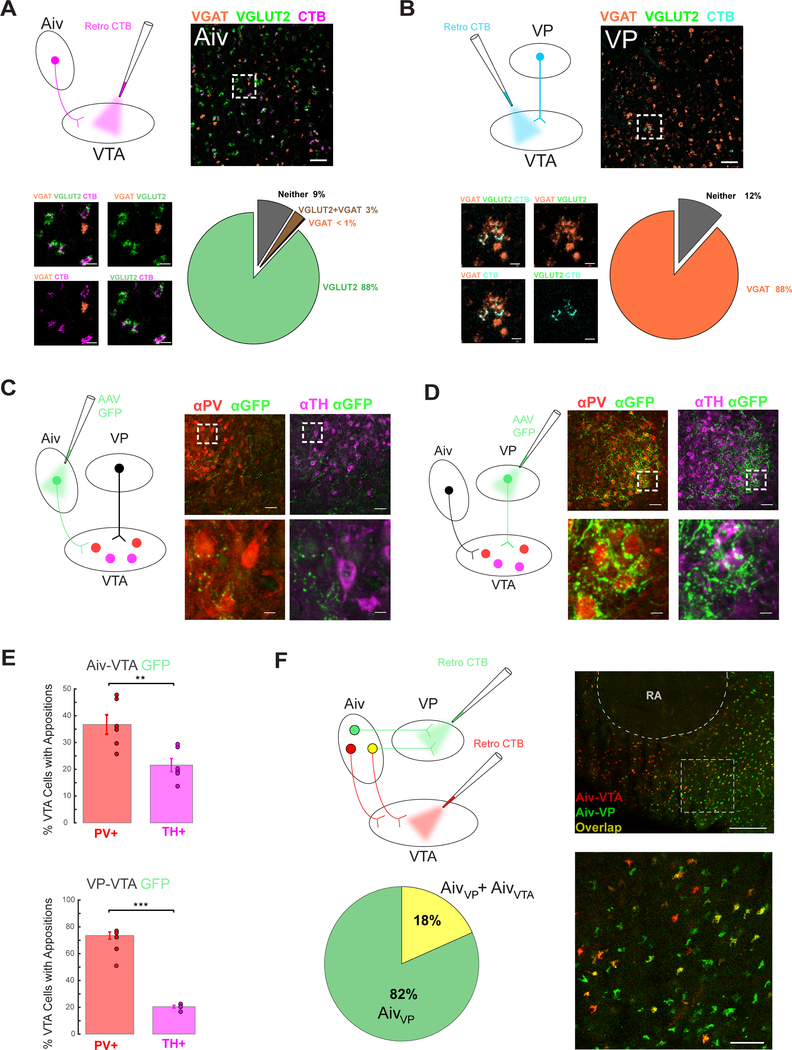
Figure 7: Neurotransmitter phenotypes and synaptic structure of VTA afferents.
(A) Upper left, schematic of injection of CTB into VTA to label AivVTA neurons. Upper right, AivVTA projecting neurons (magenta), VGLUT2 (green), and VGAT (red), scale bar 50 μm. Bottom left, higher magnification views, all scale bars 10 μm. Bottom right, pie chart of percentage of AivVTA cells positive for VGLUT2, VGAT, both, and neither (gray). (B) Upper left, schematic of injection of CTB into VTA to label VPVTA neurons. Upper right, VPVTA projecting neurons (teal), VGLUT2 (green), and VGAT (red), scale bar 50 μm. Bottom left, higher magnification views, all scale bars 10 μm. Bottom right, pie chart of percentage of VPVTA cells positive for VGLUT2, VGAT, both, and neither. (C) Left, viral injection of GFP into Aiv to express in AivVTA terminals. Top middle and right, PV+ (red) and TH+ neurons (pink) respectively with Aiv terminals (green) in VTA, scale bar 50 μm. Bottom middle and right, higher magnification view showing Aiv terminals in apposition to PV+ (middle, red) and TH+ (right, pink) cell bodies, scale bar 10 μm. (D) Same as (C) but for VPVTA GFP terminals. (E) Top, bar graph of appositions from AivVTA GFP terminals on PV+ (red) and TH+ (pink) cells in the VTA. Bottom, same as (E) but for VPVTA GFP terminals onto VTA neurons. (F) Upper Left, schematic of injection of CTB into VTA and VP to retrogradely label AivVTA neurons and AivVP neurons. Bottom left, pie chart of overlap of AivVP neurons with AivVTA neurons. Top right, AivVTA (red), AivVP (green), and co-localized (yellow) neurons, scale bar 200 μm, sagittal view with the song nucleus RA outlined. Bottom right, higher magnification view, scale bar 50 μm.

