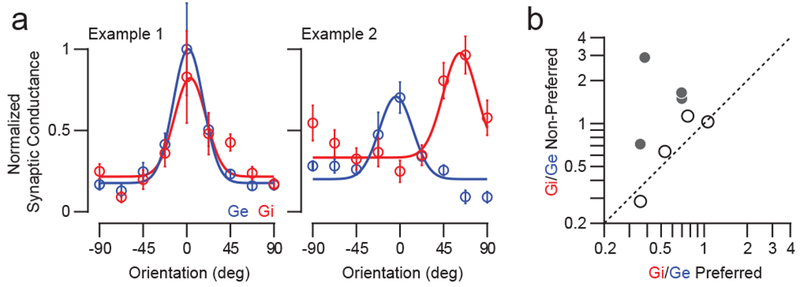
Figure 4. Comparison of inhibitory and excitatory conductance orientation tuning.

(a) Orientation tuning of synaptic conductance from two example cells. Shown are peak responses of inhibition (Gi, red) and excitation (Ge, blue). Data are mean and standard error. Gaussian tuning curves are least-squared fits. (b) Comparison of Gi/Ge for preferred and non-preferred orientations. Filled circles: Cells with significantly different Gi/Ge ratios.
