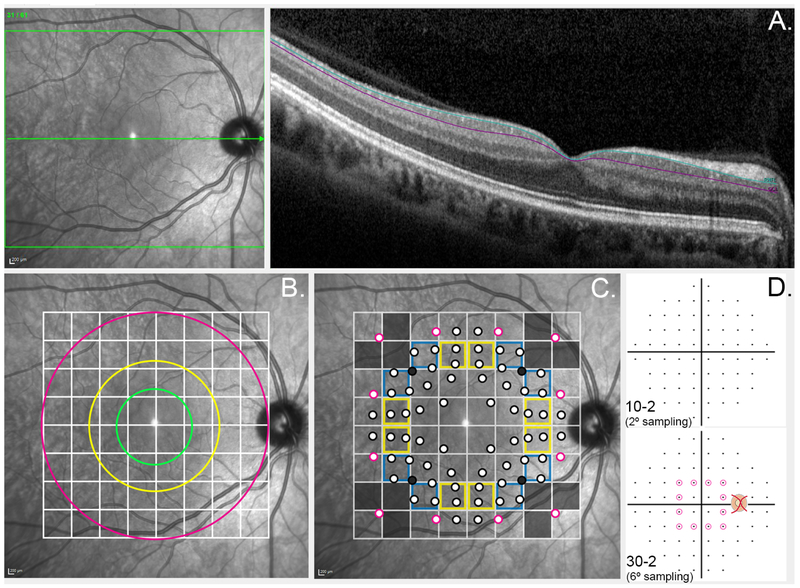
Figure 1. Schematic illustrating methodology to obtain structural measurements.
(A) Ganglion cell layer thickness (GCL) measurements (depicted between aquamarine and purple lines) were extracted from Spectralis OCT B-scans oriented to the horizontal raphé (green arrow). (B) The default Spectralis OCT posterior pole grid centered on the horizontal raphé indicates 64 areas over which measurements were averaged. The green, yellow and fuchsia rings coincide with the outermost boundary of the fovea, parafovea and perifovea respectively. (C) Projected visual field test locations are indicated in relation to the Spectralis OCT posterior pole grid. Corrections were applied to account for the relative displacement of the corresponding GC locations secondary to relative elongation of Henle’s fibers at the central fovea.23 Points outlined in black indicate points from the 10-2 testing paradigm, and points outlined in fuchsia indicate the 12 paracentral points from the 30-2 testing paradigm. For grids outlined in yellow or blue, 2 or 3 visual field measurements respectively were averaged to obtain an average visual field sensitivity corresponding to the GCL measurement for the particular grid square. Grey points and grid squares indicate visual field points and ganglion cell layer measurements were excluded from structure-function analyses. (D) The 10-2 (2° separation between test points) and 30-2 Humphrey visual field test paradigms (6° separation between test points). The visual field points on the 30-2 grid circled in fuchsia indicate the paracentral points utilized in the structure-function correlations in this study.

