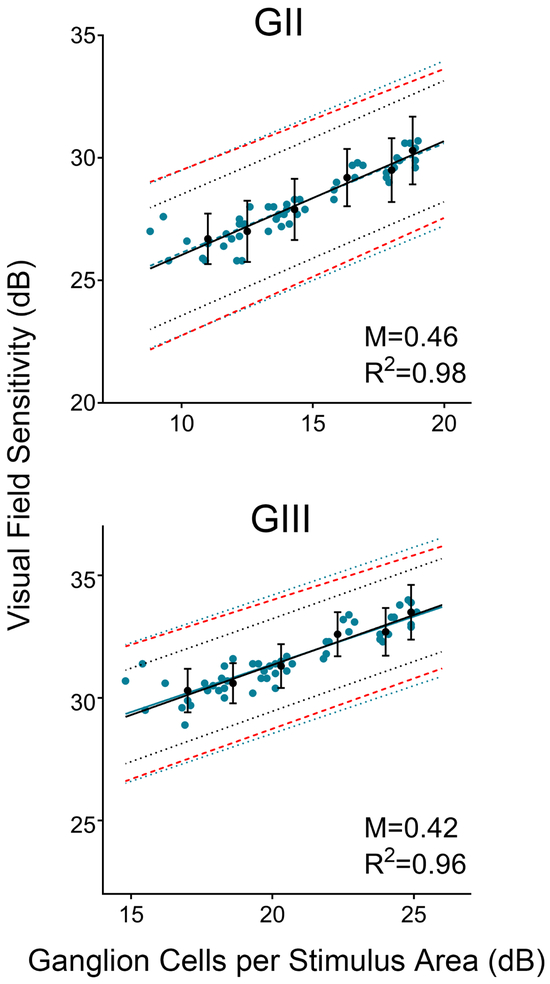
Figure 4. Structure function correlations result in narrow 95% prediction intervals.
Linear structure-function correlations for ganglion cell per stimulus area measurements derived from OCT and visual field locations grouped according to Pattern 2 (6 clusters), for GII and GIII visual field stimuli. Mean and standard deviation of clustered ganglion cells per stimulus area are plotted against the mean visual field sensitivity (●, black points) providing the basis for the corresponding indicated 95% prediction intervals (•••••, black dotted lines). The equivalent outcomes are illustrated for non-clustered, gridwise data (● blue points), resulting in much wider 95% prediction intervals (•••••, blue dotted lines). Intervals corresponding to 2× the standard deviation, commonly equated to the normal variability of visual field sensitivity data, is provided as reference from the current data set (- - - -, red dashed lines). Error bars indicate standard deviations per cluster. M and R2 indicate the slope and coefficient of determination respectively of the structure-function relationships depicted.

