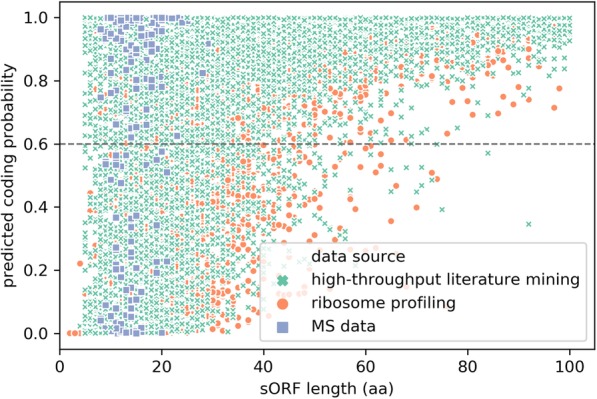
Fig. 2.

Predicted Coding Probability. Coding probability as a function of the predicted small ORF length. Scatterplot of the length of sORF vs. predicted coding probability for the non-high-confidence sORFs in SmProt. aa: number of amino acids. The y = 0.6 horizontal line separates sORFs that are predicted as positive (predicted coding probability ≥0.6) and the rest predicted negative
