Fig. 5.
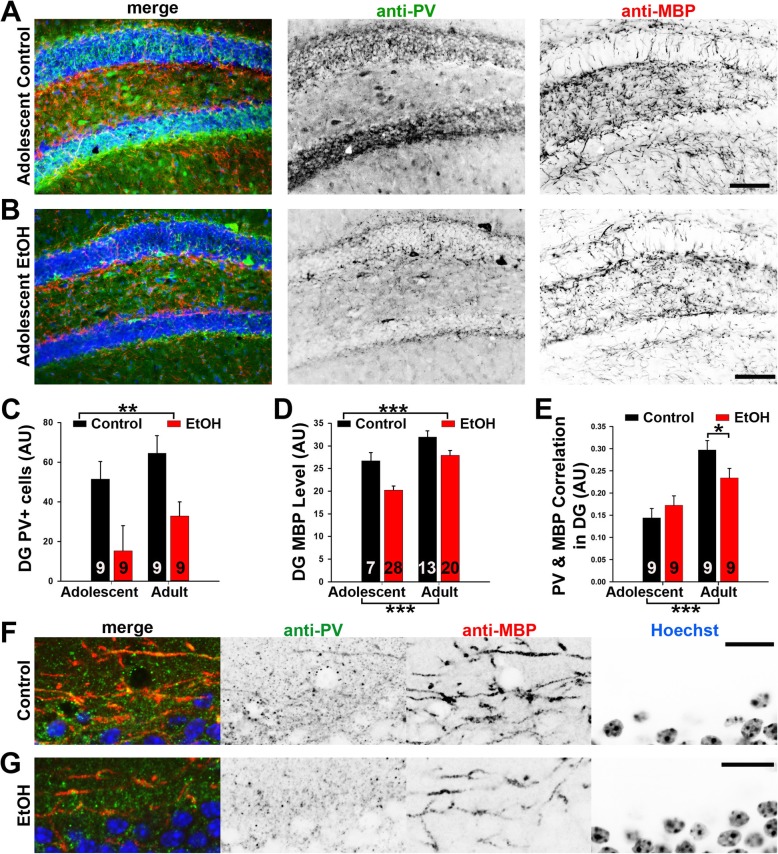
PV+ neurons and MBP+ myelin density in the hippocampus significantly reduced after ABET, which persisted into adulthood. The mice were cardiac perfused and their brains were fixed for anatomical studies after behavioral testing as described in Fig. 1. Representative images for PV (green in merge), MBP (red in merge) and Hoechst (blue in merge) co-staining in the dentate gyrus (Bregma − 2.06) of the control (a) and EtOH (b) adolescent mice. Signals are inverted in gray scale images. c Summary of PV+ cell body density in the hippocampus. d Summary of MBP+ myelin density in the hippocampus. Two-way ANOVA: **, p < 0.01; ***, p < 0.001. e Summary of PV and MBP correlation. Two-way ANOVA followed by post hoc Tukey’s test: *** p < 0.001; *, p < 0.05. f Confocal image for PV, MBP and Hoechst staining in control adolescent mouse. g Confocal image for PV, MBP and Hoechst staining in adolescent mouse with ABET. Scale bars, 250 μm in (a) and (b), 50 μm in (f) and (g)

