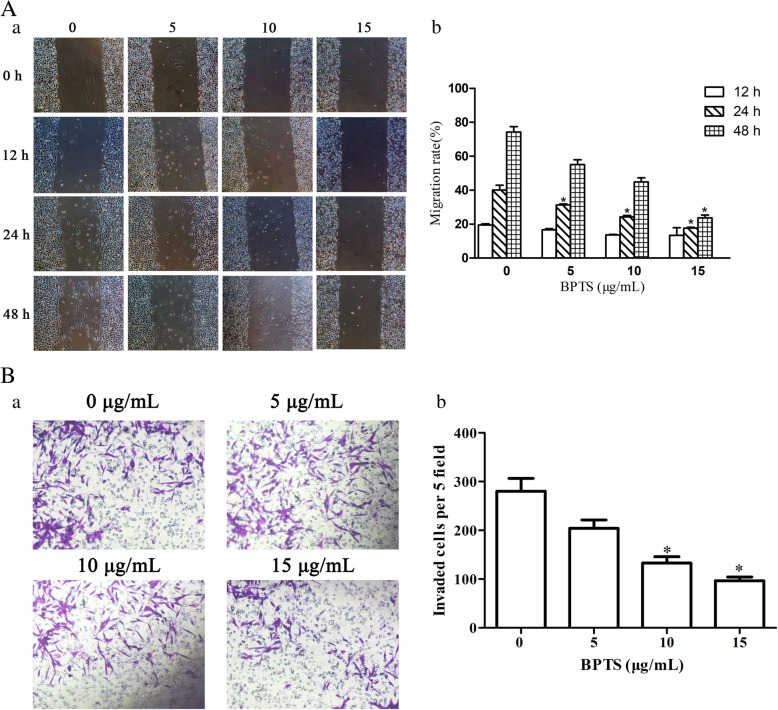
Fig. 4.
Representative images from wound healing and transwell migration assays of cells treated with BPTS were obtained after treatment with different concentrations of BPTS. (a) Representative image of the wound-healing and transwell migration assays. (b) Quantification of wound healing and transwell migration rate. *P < 0.05 vs. 0 μg/mL of BPTS

