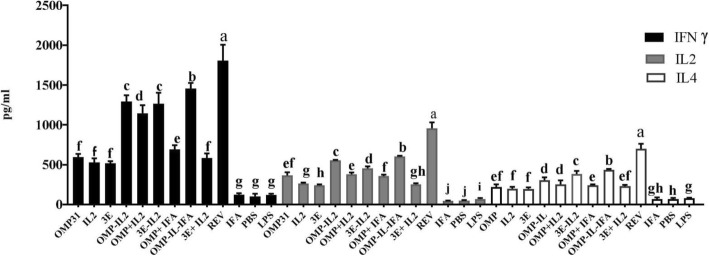
Fig. 2.
Determination of cytokine responses in splenocyte of immunized mice with different recombinant proteins. Levels of each cytokine were quantified (pg/mL) by ELISA. Mean comparison of treatments were carried out employing Tukey’s test with significance level of 0.05. Each value represents the mean of triplicates ± SD of cytokine responses from five samples. The experiment was replicated three times. Different letters indicate significantly different between experimental groups (P < .05)

