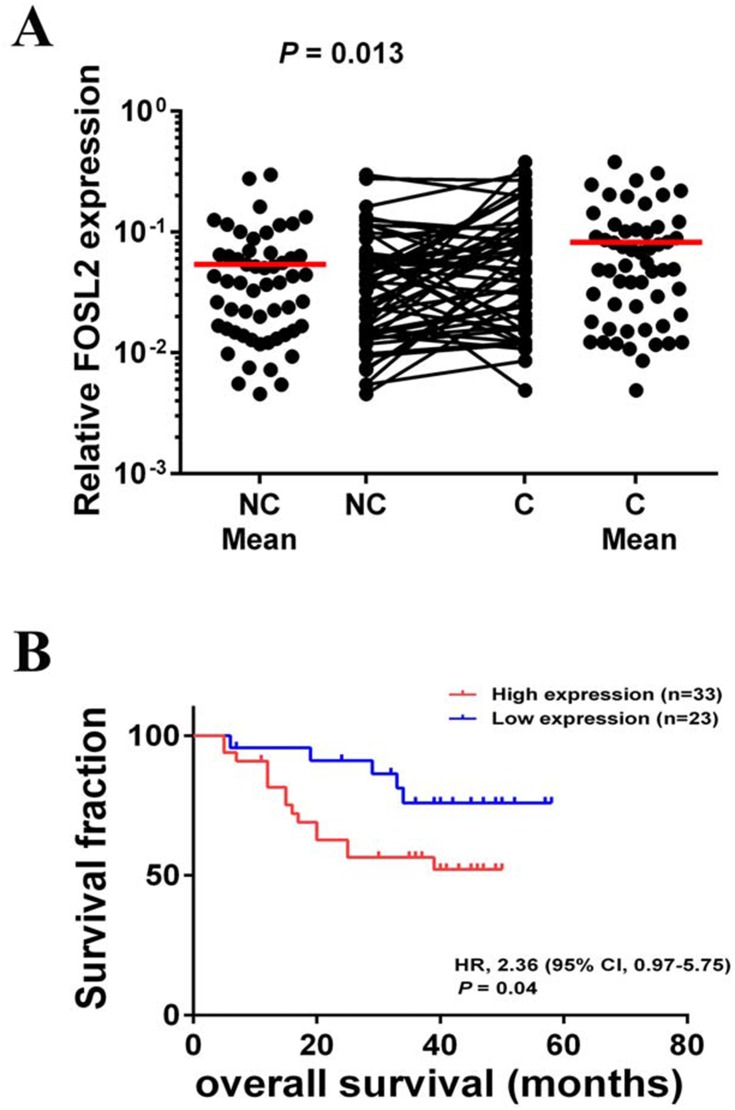
Figure 6.
FOSL2 expression levels were associated with prognosis of NSCLC. (A) Scatter plots of expression levels of FOSL2 in NC and C tissues. (B) Kaplan-Meier analysis of overall survival in NSCLC patients with primary tumors assessed for expression levels of FOSL2. The P values correspond to hazard ratios (HR). NC, adjacent carcinoma tissues; C, primary carcinoma tissues.

