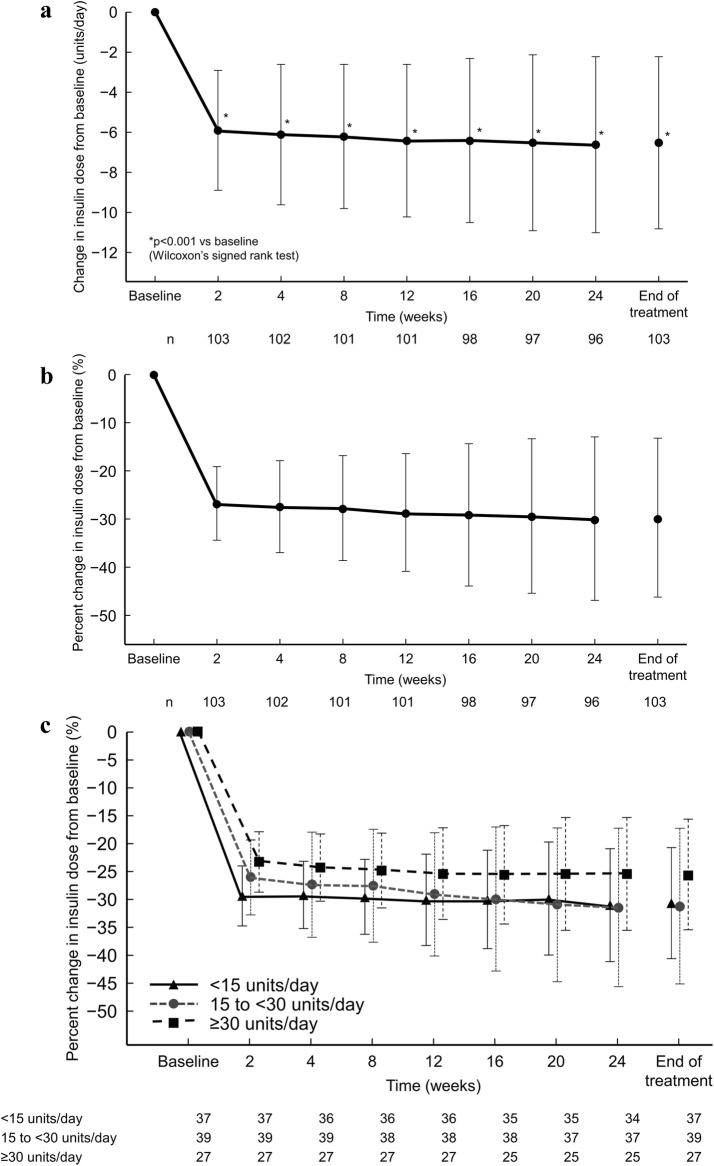
Fig. 1.
Insulin dose during the study. a Time-course of change in insulin dose. *p < 0.001 vs baseline (Wilcoxon’s signed rank test). b Time-course of percent change in insulin dose. c Time-course of percent change in insulin dose stratified by baseline insulin dose (< 15, 15 to < 30, and ≥ 30 units/day). All values are means and the error bars represent standard deviations

