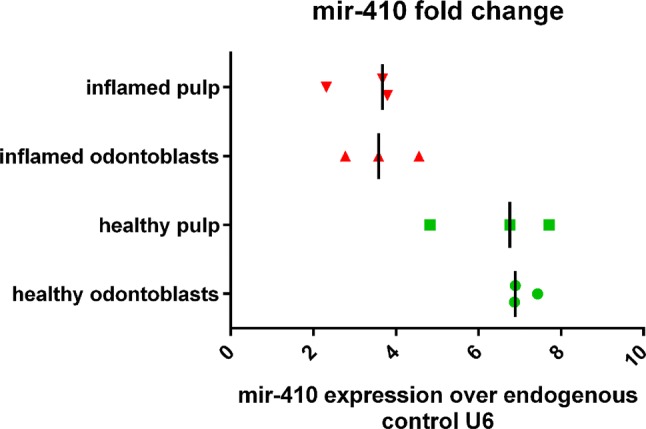
Fig. 4.

The relative level of the miR-410 expression over the endogenous control U6. The graph shows distinction into different subgroups: healthy, inflamed, pulp and odontoblasts. Median value is signed with line. The total level of the miR-410 expression in inflamed tissue was lower compared to healthy ones
