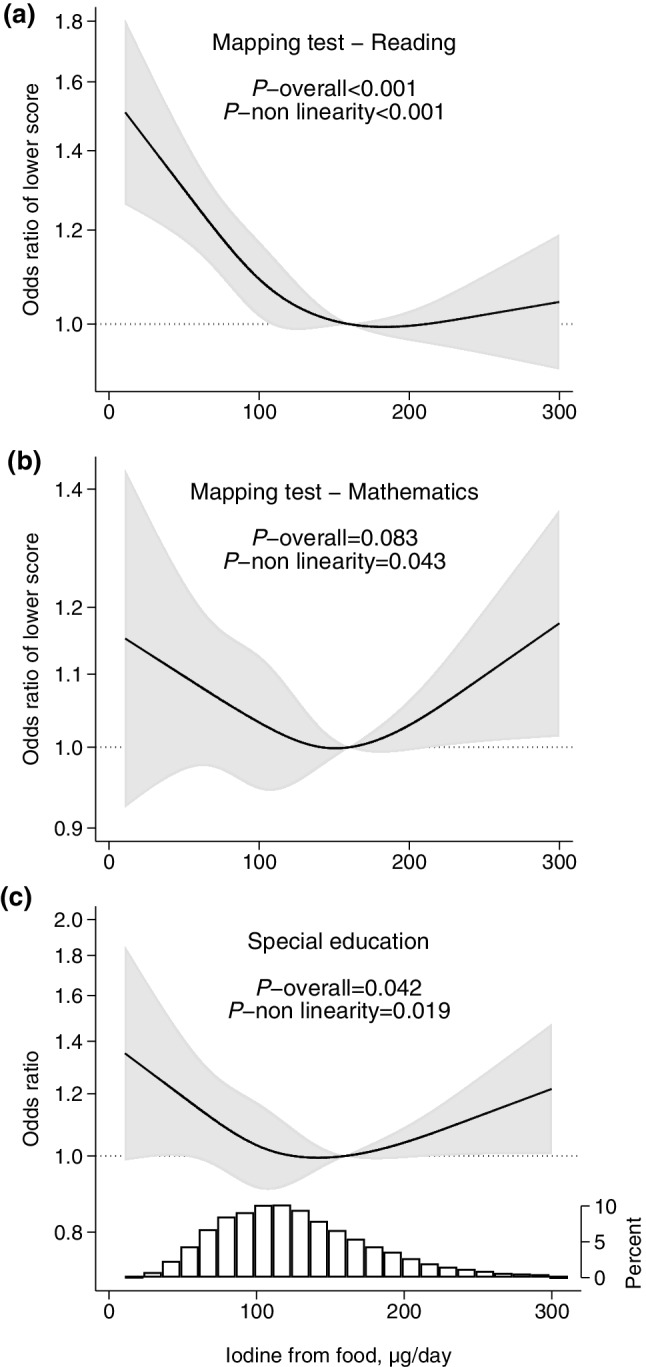
Fig. 3.

Maternal iodine intake from food (in non-supplement users) and child school outcomes at age 8 years, adjusted models. Higher odds ratio indicate poorer test results (a, b) and increased likelihood of receiving special educational services (c). The reference level (OR = 1) was set to 160 µg/day. Sample size was n = 24,309 for mapping tests in reading (a), n = 23,527 for mathematics (b), n = 24,806 for special education (c). The histogram in c represents the distribution of iodine intake. For crude models, see Supplementary Figure S8 (Online Resource 1)
