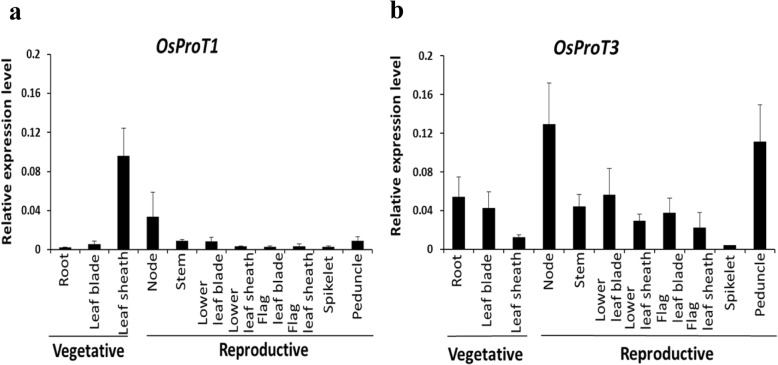
Fig. 6.
Expression levels of OsProT1 and OsProT3 in different organs at vegetative and reproductive stages. a and b, Different samples were collected from rice grown in the soil. The expression levels of OsProT1 (a) and OsProT3 (b) were determined by real-time RT-PCR using the OsACTIN1 gene as internal control. Values are means ± SD, n = 4

