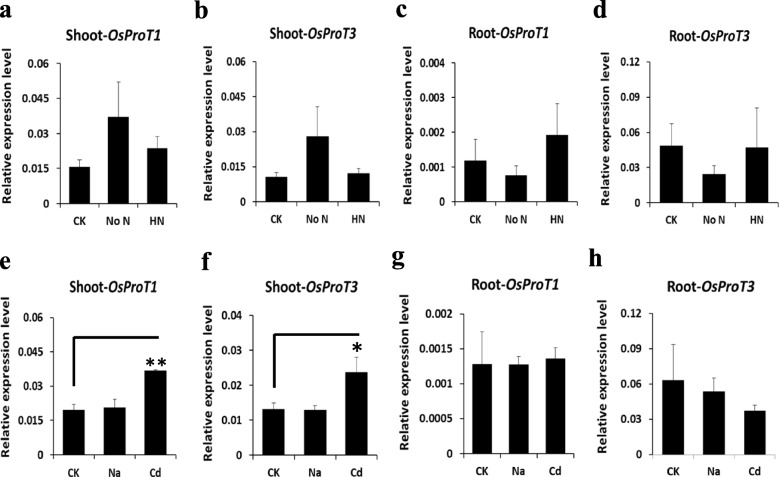
Fig. 7.
Expression levels of OsProTs in response to different abiotic stresses. a-d, OsProT1 (a, c) and OsProT3 (b, d) transcript levels in response to nitrogen deficiency or high nitrogen treatment. e-h, Expression levels of OsProT1 (e, g) and OsProT3 (f, h) in response to salt stress or cadmium treatment. Rice plants were grown hydroponically for about 2 weeks using Yashida solution, and then exposed to Yoshida solution (CK) or Yoshida solution without NH4NO3 (No N), with 10 mM NH4NO3 (HN), with 50 μM CdCl2 (Cd) or with 100 mM NaCl (Na) for 2 days. Roots and shoots were harvested for RNA extraction and detection of OsProTs expression level. Values are means ± SD, n = 3. Statistical significance was tested by two-tailed Student’s t tests. Differences were dseemed significant at P < 0.05 (*) and extremely significant at P < 0.01 (**)

