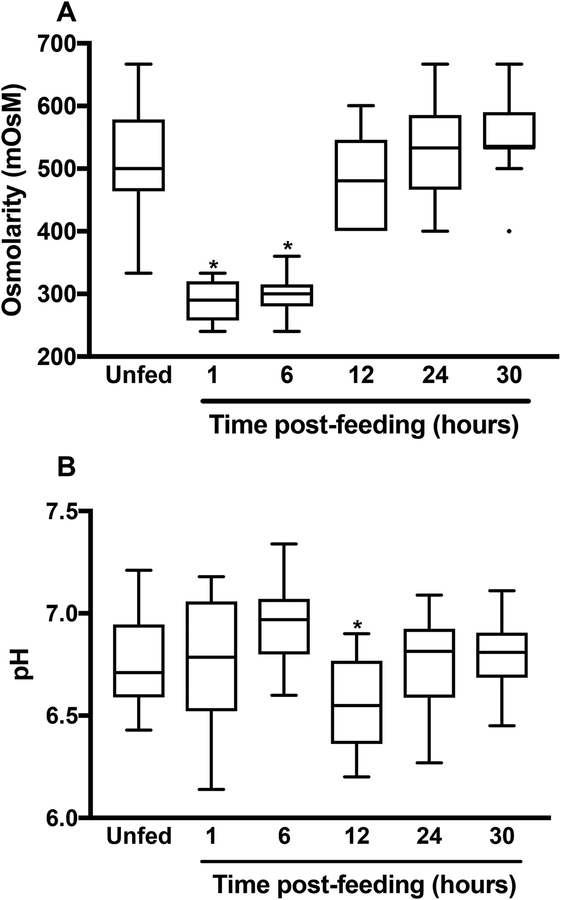
Figure 1. The flea gut is a fluctuating environment.
The box-and-whiskers (Tukey) plots represent the osmolarity (A) and pH (B) in the gut of X. cheopis fleas at different times after a blood meal. The osmolarity and pH of the blood used to feed the fleas are also shown. The mean ± SEM values were based on 16–21 samples, except for the osmolarity measured at 24 and 30h for which 9 and 12 samples were used, respectively. The osmolarity immediately after and 6 hours after the blood meal and the pH value 12 hours after the blood meal differed significantly from all the other measured values (*, p<0.008 in a one-way analysis of variance with Holm-Sidak’s correction for multiple comparisons).

