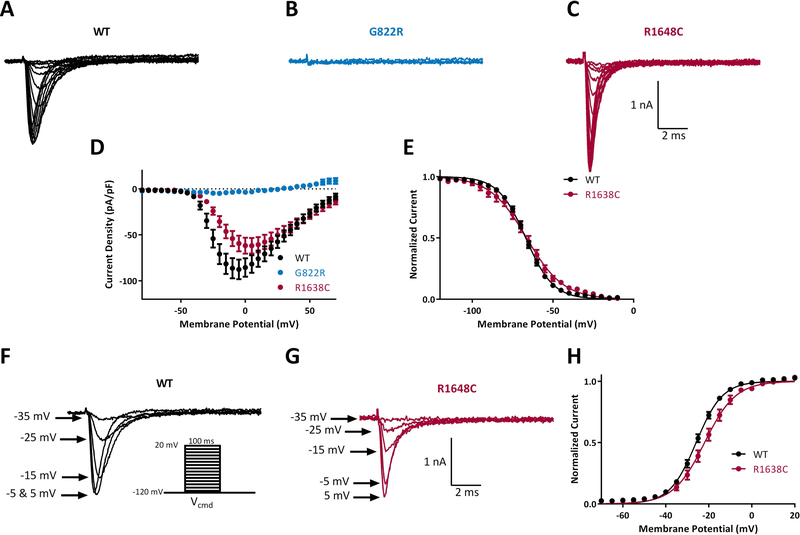
Figure 3.
Biophysical characterization of sodium channel variants in family 2. Representative traces of families of sodium channel currents recorded from ND7/23 cells expressing A. WT, B. G822R and C. R1648C. D. Averaged current-voltage (I-V) curves for WT (n = 37), G822R (n = 9) and R1638C (n = 12). E. Voltage dependence of steady state inactivation for WT (n = 37) and R1638C (n = 12). Example traces of sodium currents recorded for WT (F) and R1648C (G) showing a reduction in current amplitude in R1648C cells compared with WT at a given activation voltage. Inset shows activation voltage protocol. H. Voltage dependence of activation for WT (n = 37) and R1638C (n = 12). Data represent means ± SEM. Smooth lines in E and H correspond to single Boltzmann equation fits to average data.

