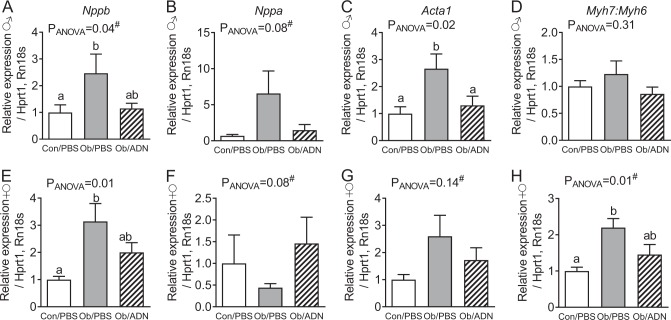
Fig. 3.
Cardiac foetal gene programme expression in 3-month-old offspring. Mean ± SEM relative expression of cardiac foetal genes indicative of pathological hypertrophy in the hearts of 3-month-old male (a–d, n = 12–15) and female (e–h, n = 8–11) offspring of control, phosphate-buffered saline (PBS)-infused pregnant mice (C/PBS) and obese pregnant mice infused either with PBS (Ob/PBS) or adiponectin (Ob/AND) from E14.5 to 18.5. Overall effect of maternal treatment group by one-way analysis of variance (ANOVA) given in figure. Values with different superscripts, a or b, are significantly different from one another by pairwise post hoc comparison (P < 0.05, Holm–Sidak test). Relative expression values of omitted outliers (Grubbs’ test): a C/PBS 3.65, Ob/PBS 10.96; b C/PBS 4.53, Ob/PBS 0.45; c C/PBS 3.62, Ob/PBS 21.34; d Ob/PBS 38.22; e C/PBS 3.13, Ob/ADN 12.38; f Ob/ADN 28.43; h Ob/ADN 120.77. Hash (#) indicates ANOVA performed on log-transformed data

