
Figure 4:
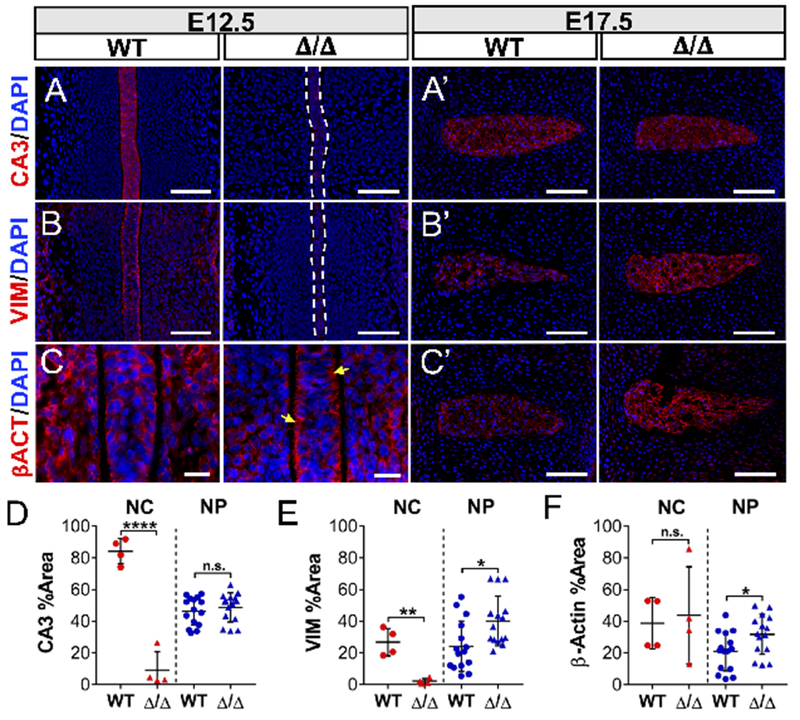
The NFAT5 null notochord exhibits delayed acquisition of its molecular phenotype and shows evidence of a disorganized cytoskeleton. (A, A’) Deletion of NFAT5 significantly reduced notochordal expression levels of carbonic anhydrase 3 (CA3), whereas expression was restored in the NP at E17.5. (B, B’) Mutant notochord showed nearly undetectable expression levels of vimentin (VIM), with increased levels in the NP at E17.5. Scale bar = 100 μm (C) High magnification images show reduced β-actin localization to the submembranous cortex in null notochord cells (yellow arrows). Scale bar = 20 μm. (C, C’) There were no changes in β-actin expression at E12.5 between genotypes, however, E17.5 embryos showed moderately increased levels. Scale bar = 100 μm. Staining against CA3 (D), vimentin (E), and β-actin (F) was quantified by Area Fraction (% Area). Quantitative measurements represent mean ± SD. n.s. = not significant; *, p ≤ 0.05; **, p ≤ 0.01; ****, p ≤ 0.0001.