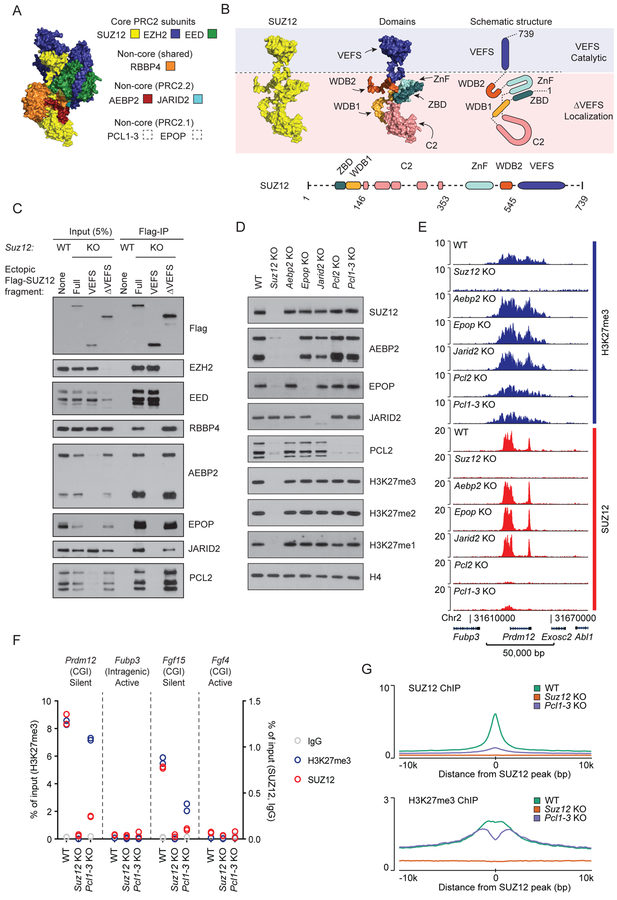
Figure 1: Individual non-core PRC2 subunits are dispensable for target site specificity.
A) Structure of PRC2 based on superimposition of two partial crystal structures, PDB ID: 5WAI (Chen et al., 2018) and PDB ID: 5LS6 (Vaswani et al., 2016) onto Cryo-EM structure, PDB ID: 6C23 (Kasinath et al., 2018). SUZ12 (yellow), EED (green), EZH2 (blue) with fragments of AEBP2 (red) and JARID2 (turquoise). PRC2.1 subunits are not part of this structure.
B) Top left: Structure of SUZ12 (yellow) from Figure 1A. Top middle: Structure of SUZ12 colored to highlight individual domains. Top right: Schematic drawing of SUZ12 with colored domains. Blue and pink shades indicate parts of SUZ12 required for catalytic activity (VEFS) or target localization (ΔVEFS). Bottom: Schematic drawing of domain architecture of SUZ12 with indication of boundaries (amino acid numbers) for the fragments used in this study. Dashed lines indicate structurally unresolved regions.
C) Western blot for PRC2 subunits of cell extracts (input) and anti-Flag immunoprecipitated material (Flag-IP) from the indicated cell lines (wildtype mESC (WT) or Suz12 KO mESC (KO) with ectopic expression of indicated Flag-tagged SUZ12 constructs).
D) Western blot for PRC2 subunits and H3K27 methylation, probing extracts prepared from the indicated knockout cell lines.
E) H3K27me3 and SUZ12 ChIP-seq signals for the indicated cell lines in a representative genomic region including the PRC2 target gene Prdm12. ChIP-seq signals are sequence-depth normalized (reads per kbp per million mapped reads (RPKM)). ChIP-seq signals in two other representative genomic regions are shown in Supplementary Figure 1. Mean signals in regions centered on SUZ12 peaks are shown in Figure S1D–E.
F) ChIP-qPCR signals for H3K27me3 (blue, left y-axis scale), SUZ12 (red), and IgG control (gray) (right y-axis scale) in WT, Suz12 KO and Pcl1–3 KO cell lines at PRC2 target sites (CGI promoters of Prdm12 and Fgf15) and control regions (intragenic Fubp3 and CGI-promotor of Fgf4) present in tracks shown in Figure 1E and Supplementary Figure 1. The transcriptional status and presence of overlapping CGI is indicated for each probed region. Data values come from a single biological (n = 1) experiment with two technical replicate values shown.
G) Mean SUZ12 (top) and H3K27me3 (bottom) ChIP-seq signals (RPKM) for WT, Suz12 KO and Pcl1–3 KO cell lines in regions centered on 7,796 SUZ12 peak regions identified in WT mESCs.

