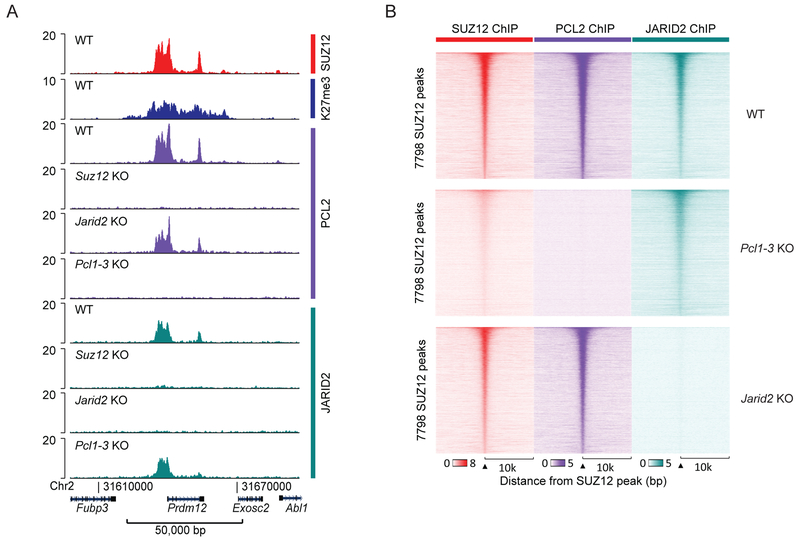
Figure 3: PRC2.1 and PRC2.2 binding sites overlap.
A) SUZ12, H3K27me3, PCL2 and JARID2 ChIP-seq signals (RPKM) from the indicated cell lines within a representative genomic region that includes the PRC2 target gene Prdm12.
B) Heatmaps of SUZ12, PCL2 and JARID2 ChIP-seq signals (RPKM) from the indicated cell lines, sorted according to peak-calling statistical strength (FDR) for the 7,796 identified SUZ12-positive peaks. Horizontal axis shows a 20,000 bp window centered on SUZ12 peaks.

