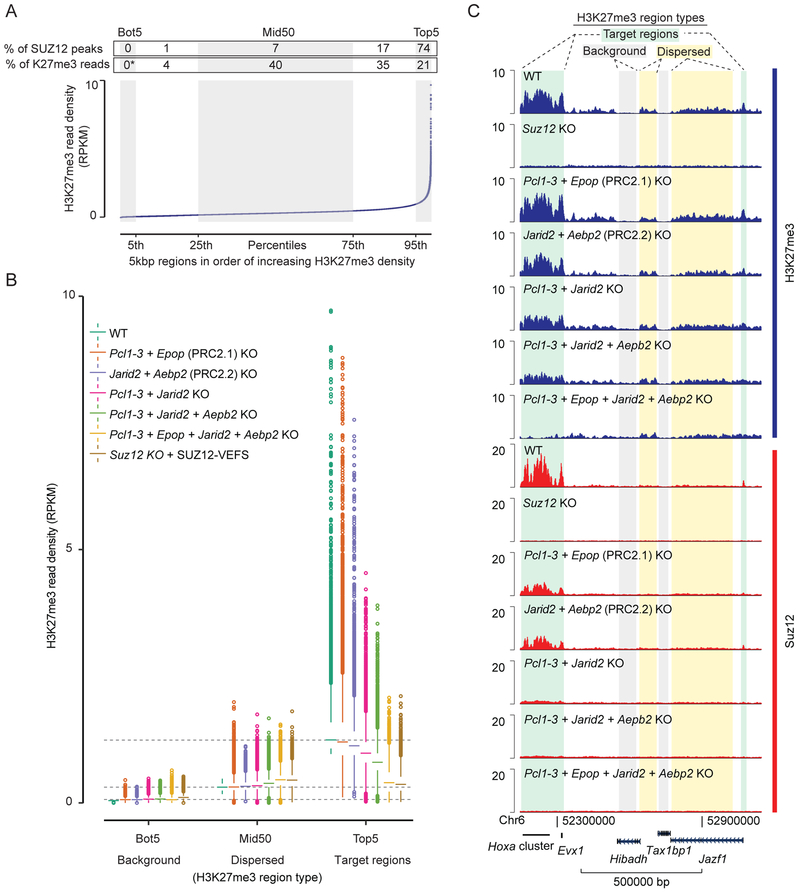
Figure 5: Dispersed and recruitment-dependent populations of H3K27me3 regions.
A) Plot of average H3K27me3 signal (RPKM) within 5kbp regions spanning the entire genome. Regions are ordered based on increasing H3K27me3 density in WT cells. The ordered regions are divided into percentile groups (alternating gray and white). The bottom (Bot5) and top (Top5) percentile regions are marked, as well as the middle 50 percentiles (Mid50). Above graphs, each region is annotated with the percentage of total SUZ12 peak overlaps that belong to the region, and percentage of total H3K27me3 reads (with Bot5 used to approximate non-specific background reads and set to zero) within the region. Mean values of two replicate experiments (n = 2) are used.
B) Box plot of H3K27me3 read densities (RPKM) for the Bot5, Mid50 and Top5 regions defined in panel A for the indicated cell lines (color coded). Boxes extend from first to third quartile with a band marking the median. Whiskers extend to values up to 1.5 interquartile distances from box, and all additional values outside of this range are marked with circles. Mean values of two replicate experiments (n = 2) are used.
C) H3K27me3 and SUZ12 ChIP-seq signals (RPKM) from indicated cell lines within a representative 1Mbp genomic region that include different types of H3K27me3 regions marked above tracks. Genomic coordinates and genes that lie within the shown region are marked below tracks.

