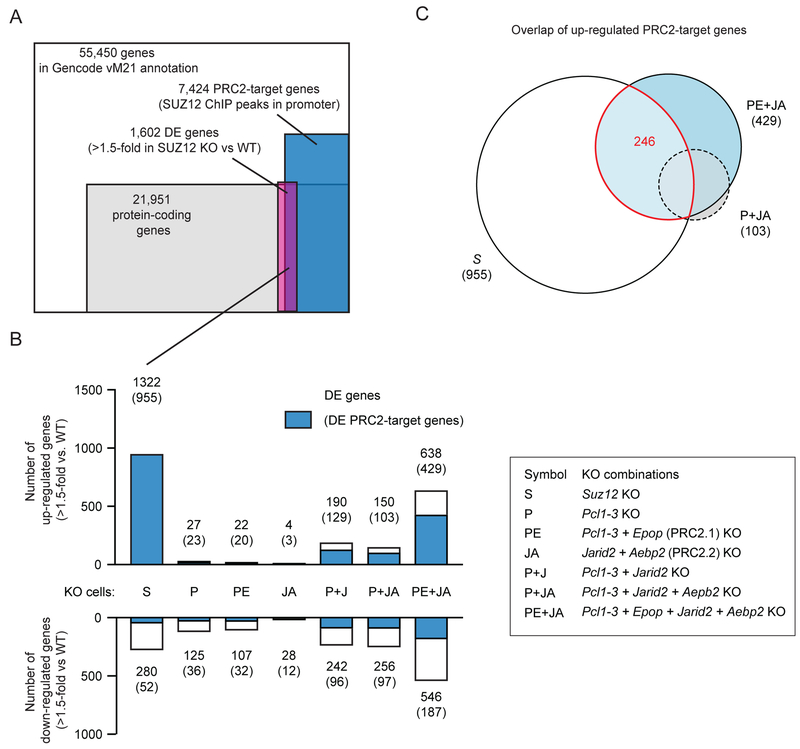
Figure 7: Loss of PRC2 target site-specific H3K27me3 causes derepression of many PRC2 target genes.
A) Overlap between genes that are differentially expressed in Suz12 knockout versus WT cells (DEseq2, fold change > 1.5, padj < 0.1), protein coding genes of the Gencode version M21 gene annotation and PRC2 target genes defined by presence of SUZ12 ChIP-seq peak within 2500bp of TSS.
B) Bar graph of the number of differentially expressed genes that are upregulated (top) or downregulated (bottom) for each of the indicated cell lines compared to WT cells (DEseq2, fold change > 1.5, padj < 0.1). The number of genes, which are also PRC2 target genes are marked with blue in the bar graph and written above bar in parenthesis.
C) An Euler-diagram of the overlap between upregulated PRC2 target genes in indicated cell lines.

