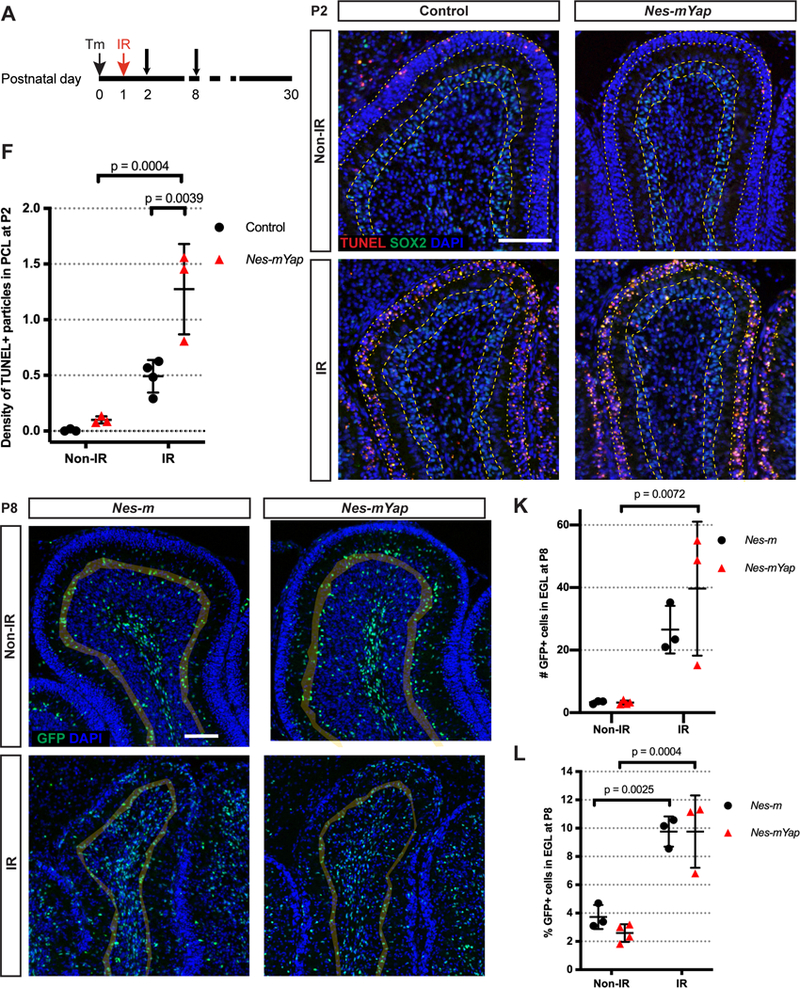
Figure 3. Deletion of Yap in NEPs at P0 results in an increase in cell death in the PCL after irradiation-induced injury at P1.

(A) Schematic showing experimental design. (B-E) Representative images from lobule 4/5 showing IF staining for TUNEL, SOX2, and DAPI on midsagittal sections from IR and Non-IR Nes-mYap cKOs and controls one day after IR at P1. Grey shadow highlights the PCL of the lobule. Arrows indicate TUNEL+ particles in the PCL. Scale bar, 100 μm. (F) Graph of the densities of TUNEL+ particles in the PCL of the midline cerebella from IR and Non-IR Nes-mYap cKOs (Non-IR, n = 3; IR, n = 3) and controls (Non-IR, n = 3; IR, n = 3) at P2. (G-J) Representative images from lobule 4/5 showing IF staining of GFP and DAPI on midsagittal cerebellar sections from IR and Non-IR Nes-m controls and Nes-mYap cKOs at P8. Grey shadow highlights the EGL of the lobule. Scale bar, 100 μm. (K-L) Graphs of the numbers of GFP+ cells normalized to total area measured in the EGL (K) and the percentages of GFP+ cells in the EGL among the total number of GFP+ cells (L) from Nes-m controls (Non-IR, n = 3; IR, n = 3) and Nes-mYap cKOs (Non-IR, n = 4; IR, n = 3) at P8. Data are presented as mean ± S.D., and statistical analysis by two-way ANOVA. Each data point represents one animal.
