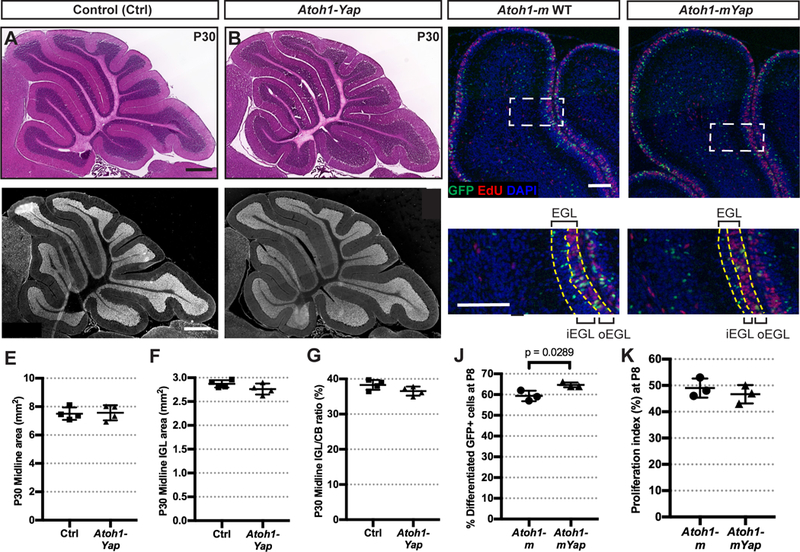
Figure 6. YAP attenuates differentiation of GCPs during postnatal development of the cerebellum.

(A-D) H&E staining (A-B) and IF detection of the granule cell marker NeuN (C-D) on midsagittal sections of cerebella from Atoh1-Yap cKOs and control (Ctrl) mice at P30. Scale bars, 500 μm. (E-G) Graphs of the areas of the midline of the cerebellum (E), the areas of the IGL (F), and IGL/cerebellum area ratios (G) of Atoh1-Yap cKO (n = 4) and littermate controls (n = 4) at P30. (E) p = 0.8554; (F) p = 0.1727; (G) p = 0.1155. (H-l) Representative images from lobule 4/5 showing IF staining for GFP, EdU, and DAPI on midsagittal sections from an Atoh1-m control and Atoh1-mYap cKO at P8 after TM at P0. (H’-l’) Magnification of areas within dotted lines in H-l. Yellow dashed lines indicate the EGL and the border of the outer-and inner-EGL. Scale bars, 100 μm. (J-K) Graphs of the percentages of GFP+ differentiating cells (in all layers except the proliferating oEGL) among all GFP+ cells (J) and proliferation indices (G) in the midline of the cerebella in Atoh1-m controls (n = 3) and Atoh1-mYap cKOs (n = 3) at P8. (K) P = 0.4670. Data are presented as mean ± S.D., and statistical analysis by unpaired t test. Each data point represents one animal.
