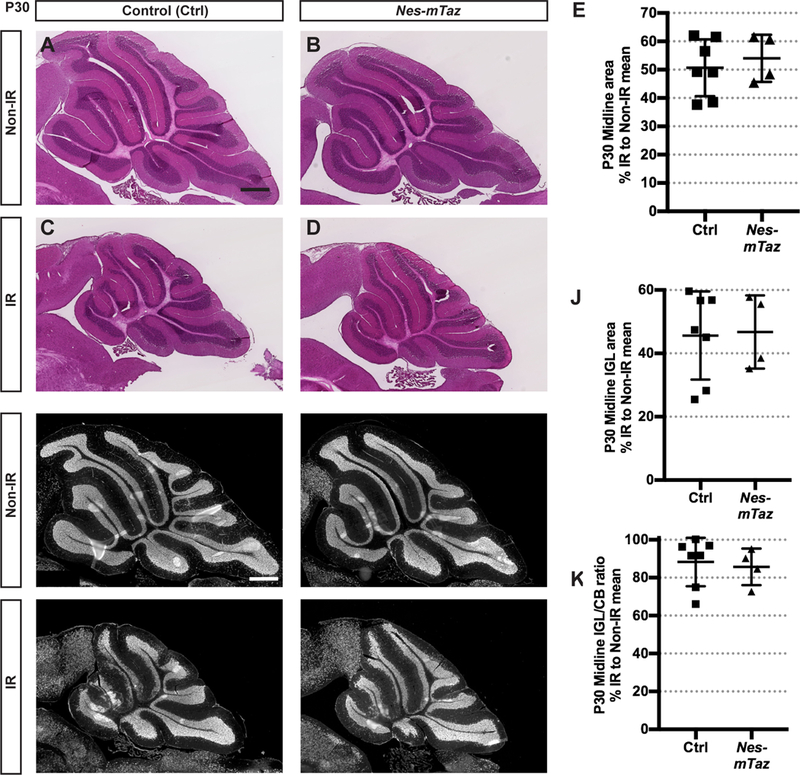
Figure 7. Mutation of Taz in NEPs at P0 does not alter cerebellar growth during development and regeneration after irradiation at P1.

(A-D) H&E staining of midsagittal sections of cerebella from Non-IR and IR of Nes-mTaz cKOs and controls at P30. Scale bars, 500 μm. (E) Graph of the areas of the cerebella of IR animals as a percentage of Non-IR mice of the same genotype in midline sections, p = 0.5866. (F-l) IF detection of NeuN on midsagittal sections of the cerebella from Non-IR and IR Nes-mTaz cKOs and controls at P30. Scale bar, 500 μm. (J,K) Graphs of the IGL areas (J) and IGL/cerebellum ratios (K) of IR Nes-mTaz cKOs (Non-IR, n = 6; IR, n = 4) and controls (Non-IR, n = 4; IR, n = 7) at P30 as a percentage of Non-IR same genotype. (J) p = 0.8945; (K) p = 0.7335. Data are presented as mean ± S.D., and statistical analysis by unpaired t test. Each data point represents one animal, and is calculated using each IR measurement divided by the mean of Non-IR mice of the same genotype, X 100.
