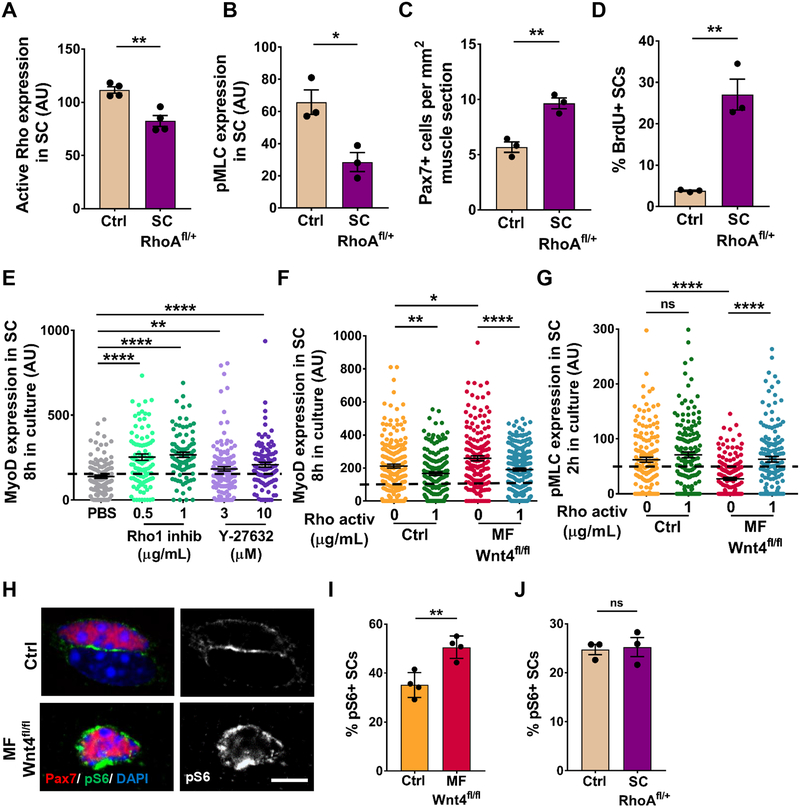
Figure 5. Niche derived Wnt4 signals via RhoA to promote quiescence.
(A) Quantification of active Rho expression in Control and SC-RhoAfl/+FACS isolated SCs, 14d post tmx (n=3).
(B) Quantification of pMLC expression in SCs on Control and SC-RhoAfl/+ isolated single muscle fibers, 14d post tmx (n=3).
(C) Quantification of Pax7+ cells per 1mm2 TA muscle section of Control and SC-RhoAfl/+, 14d post tmx (n=3).
(D) Percentage of BrdU+ SCs in Control and SC-RhoAfl/+ TA muscle sections, 14d post tmx (n=3).
(E) MyoD expression in SCs on isolated muscle fibers treated with PBS, Rhol inhibitor or ROCK inhibitor for 8h in vitro (n=2).
(F) MyoD expression in SCs on muscle fibers from Control and Myofiber-Wnt4fl/fl treated with Rho activator for 8h in vitro (n=3).
(G) pMLC expression in SCs on muscle fibers from Control and Myofiber-Wnt4fl/fl treated with Rho activator for 2h in vitro (n=3).
(H and I) Representative images (H) and quantification (I) of the percent pS6+ SCs on Control and Myofiber-Wnt4fl/fl muscle fibers, 14d post tmx (n=4).
(J) Percentage of pS6+ SCs on Control and SC-RhoAfl/+ muscle fibers, 14d post tmx (n=3).
The dashed line in Figures 5E, 5F and 5G represents the threshold of intensity visible by eye.
Error bars, s.e.m.; *P<0.05, **P<0.01, ****P<0.0001; Scale bars 5μm in (H).

