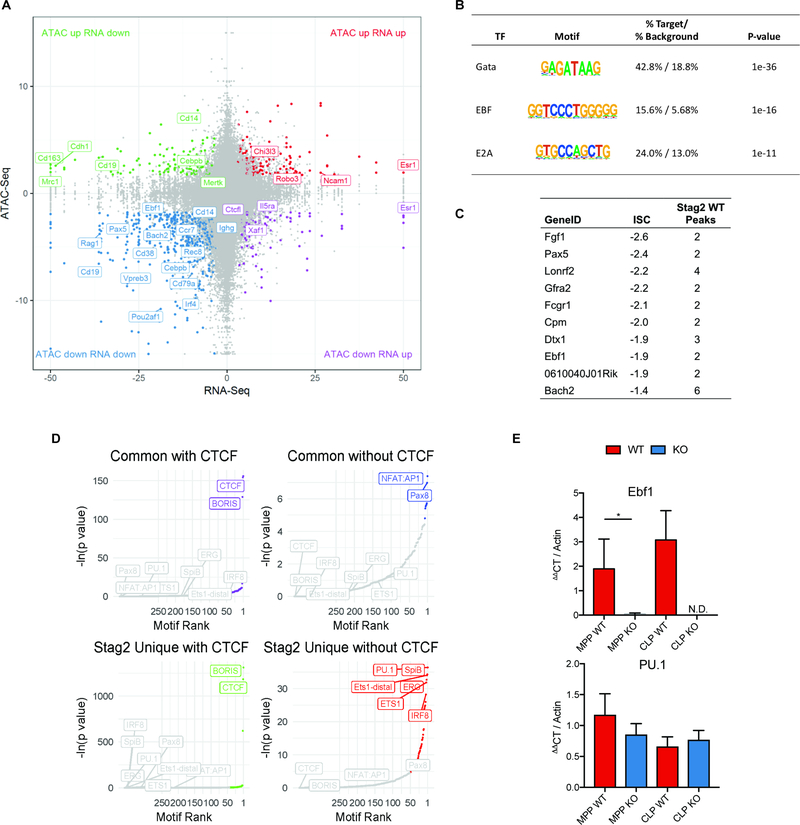
Fig 4. Stag2 loss decreases chromatin insulation and results in impaired transcriptional output.
A) Intersection of RNAseq and ATACseq in Lin− bone marrow plotted as −log10(pvalue) *sign of the Log2 fold change of Stag2 KO compared to WT and each point representing a one ATAC peak. The majority of differentially expressed genes lose accessibility, including distinct B-cell regulators (e.g. Ebf1, Pax5, Cd19). B) HOMER motif analysis of genes in lower left quadrant of Figure 4A from intersection of RNAseq and ATACseq in Lin− bone marrow. Genes that are downregulated and lose accessibility are targets of Gata (p=10−36), EBF (p=10−16), and E2A (p=10−11). C) Top 10 genes with greatest magnitude of ISC and number of WT Stag2 peaks in the gene. D) Motif analyses of common and Stag2-specific sites with and without CTCF show common enrichment for CTCF and CTCFL (BORIS). Stag2-unique sites bind targets of key lineage priming factors PU.1, SpiB, ERG, ETS1, and IRF8, which Stag1 is unable to bind. E) Putative expressers of PU.1 and Ebf1 from Stag2 WT and KO bone marrow were sorted and Ebf1 and PU.1 expression was measured by RT-PCR in multipotent progenitors (MPP) and common lymphoid progenitors (CLP). Ebf1 expression was decreased in both populations (MPP p=0.04; CLP not detectable). PU.1 expression was not statistically different in either population (MPP p=0.13; CLP p=0.32).

