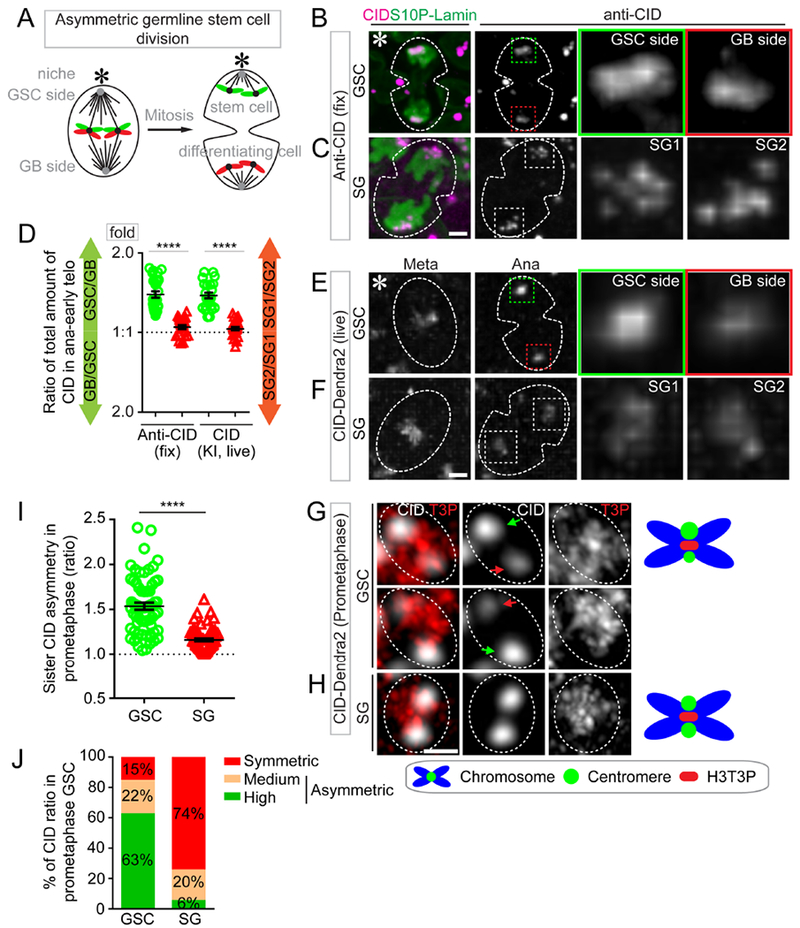
Figure 1: Asymmetric CID inheritance in Drosophila male GSCs.

(A) A cartoon depicting asymmetric Drosophila male GSC division and asymmetric histone H3 inheritance (old H3 - green, new H3 - red). (B-F) Asymmetric CID segregation in asymmetrically dividing GSCs with more CID toward the GSC side, using both immunostaining of fixed cells (B) and live cell imaging of a CID-Dendra2 knock-in line (E). In symmetric SG cell division, CID is symmetrically distributed, as determined using both immunostaining (C) and live cell imaging (F). Quantification of all four data sets in (D): 1.41± 0.04-fold for GSC/GB (n= 27), 1.06± 0.02-fold for SG1/SG2 (n= 23), as determined by anti-CID, Table S1; 1.39± 0.04-fold for GSC/GB (n= 23), 1.04± 0.02-fold for SG1/SG2 (n= 21), as determined by live cell imaging using CID-Dendra2, Table S2. (G-H) At prometaphase, using Airyscan resolved individual sister centromeres show more asymmetry in GSCs [green arrow-stronger centromere, red arrow-weak centromere, (G)], compared with resolved sister centromeres in SGs (H). (I) Quantification of individual pairs of resolved sister centromeres in GSCs (1.54± 0.04-fold, n= 65) and SGs (1.16± 0.02-fold, n= 66) at prometaphase, Table S4. (J) Percentage of different categories of symmetric (< 1.20-fold), medium asymmetric (1.20- to 1.40-fold) and highly asymmetric sister centromeres (> 1.40-fold) for GSCs (n= 65) and SGs (n= 66) in prometaphase, examples of resolved individual sister centromeres are shown in GSCs (Figure S1H) and SGs (Figure S1I). All ratios= Avg± SE. P-value: paired t test. ****: P< 10−4. Asterisk: hub. Scale bars: 2μm (B-C, E-F), 0.5μm (G-H).
