
Figure 6: Compromising the CAL1 chaperone disrupts the CID asymmetry and results in GSC defects.
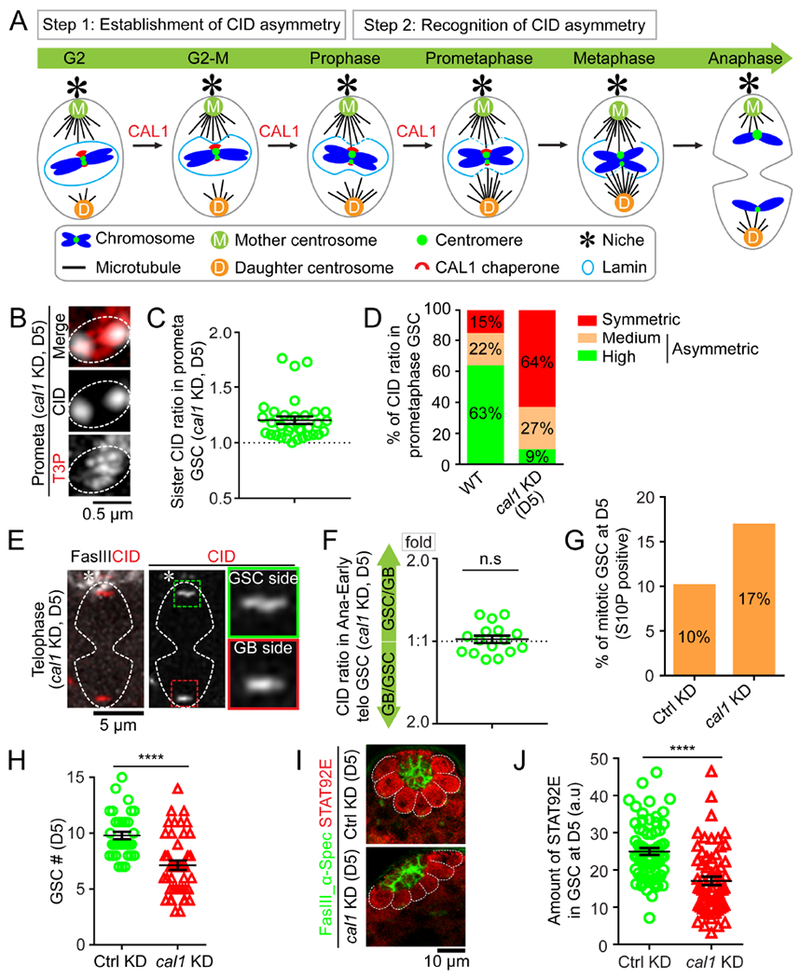
(A) A cartoon depicting a two-step model for asymmetric CID inheritance: Step 1 involves establishment of CID asymmetry at individual sister centromeres; Step 2 requires recognition of asymmetric CID by the mitotic machinery. CAL1 is likely contributing to Step 1. (B) In prometaphase GSCs after knocking down cal1 for five days (D5), resolved individual sister centromeres show symmetry, quantified in (C): 1.20± 0.03-fold, n= 33, Table S10. (D) Percentage of different categories of symmetric (< 1.20-fold), medium asymmetric (1.20- to 1.40-fold) and highly asymmetric sister centromeres (> 1.40-fold) for wild-type (WT) GSCs (n= 65) and cal1 KD GSCs (D5, n=33) at prometaphase. (E) Symmetric CID segregation in anaphase or early telophase GSCs after knocking down cal1 for five days (D5), quantified in (F): 1.03± 0.03-fold, n= 16, Table S11. (G) Mitotic index of Ctrl mCherry KD GSCs (H3S10P-positive GSCs%= 10%, n= 396) vs. cal1 KD GSCs (H3S10P-positive GSCs%= 17%, n= 480). (H) Quantification of GSCs in cal1 KD versus Ctrl testes. (I) Immunostaining using anti-Stat92E (red) in Ctrl GSCs vs. cal1 KD GSCs at D5, signals were quantified in (J). Testes were costained with a hub marker Fas III (green) and a spectrosome/fusome marker α-Spectrin (α-Spec) (green). All ratios = Avg± SE. P-value: paired t test. ****: P< 10−4; n.s: not significant. Asterisk: hub. Scale bars: 0.5μm (B), 5μm (E), 10μm (I).