
Figure 7: Depolymerizing microtubules disrupts the temporal microtubule asymmetry and results in randomized sister chromatid segregation.
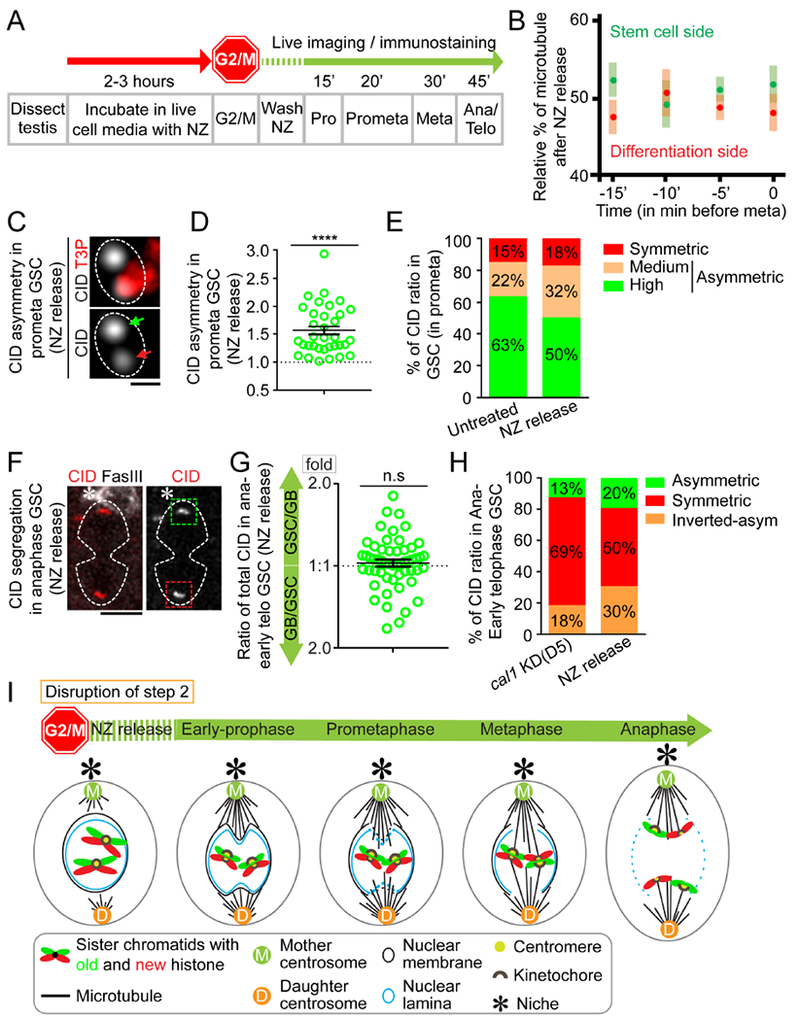
(A) A regime of Nocodazole (NZ) treatment experiment whereby testes were treated with NZ for two to three hours to arrest GSCs primarily at the G2/M transition. Immediately after washing out NZ, GSCs progress into different stages of mitosis in a time-dependent manner. (B) Immediately after releasing from NZ treatment, microtubules nucleate from both mother centrosome and daughter centrosome almost simultaneously. Percentage of microtubules emanated from mother centrosome versus daughter centrosome were quantified in GSCs (n= 10, Table S14), using α-Tubulin-GFP signals with 3D reconstructed montage made from live cell imaging, similar to quantification in Figure 4D–E. (C) In prometaphase GSCs immediately after releasing from NZ treatment, using Airyscan resolved sister centromeres display asymmetric distribution (green arrow: stronger centromere, red arrow: weaker centromere). (D) Quantification of individual pairs of resolved sister centromeres in prometaphase GSCs immediately after releasing from NZ treatment: 1.56± 0.08-fold (n= 34), Table S15. (E) Percentages of CID ratios at resolved individual sister centromeres in prometaphase with different categories in untreated GSCs (n= 65) and GSCs immediately after releasing from NZ arrest (n= 34). (F) Randomized CID segregation pattern in anaphase or early telophase GSCs immediately after releasing from NZ treatment, quantified in (G): 1.05± 0.03-fold, n= 54, Table S16. (H) Percentage of GSCs showing conventional asymmetric (see Supplemental Information for classification, GSC side/GB side≥ 1.2), symmetric (0.9< GSC side/GB side < 1.2), and inverted asymmetric (GSC side/GB side≤ 0.9, i.e. more toward GB side than to the GSC side) patterns of CID segregation at anaphase or early telophase, in cal1 KD (disrupts Step 1) and immediate release from NZ treatment (NZ release, disrupts Step 2). More symmetric segregation patterns are seen in cal1 KD compared to NZ release; both conventional asymmetric and inverted asymmetric patterns are detected with NZ release, suggesting the segregation pattern is randomized. (I) A cartoon depicting randomized sister chromatids segregation upon disrupting Step 2 without affecting Step 1. Asterisk: hub. All ratios= Avg± SE. P-value: paired t test. ****: P< 10−4; n.s: not significant. Scale bars: 0.5μm (C), 5μm (F).