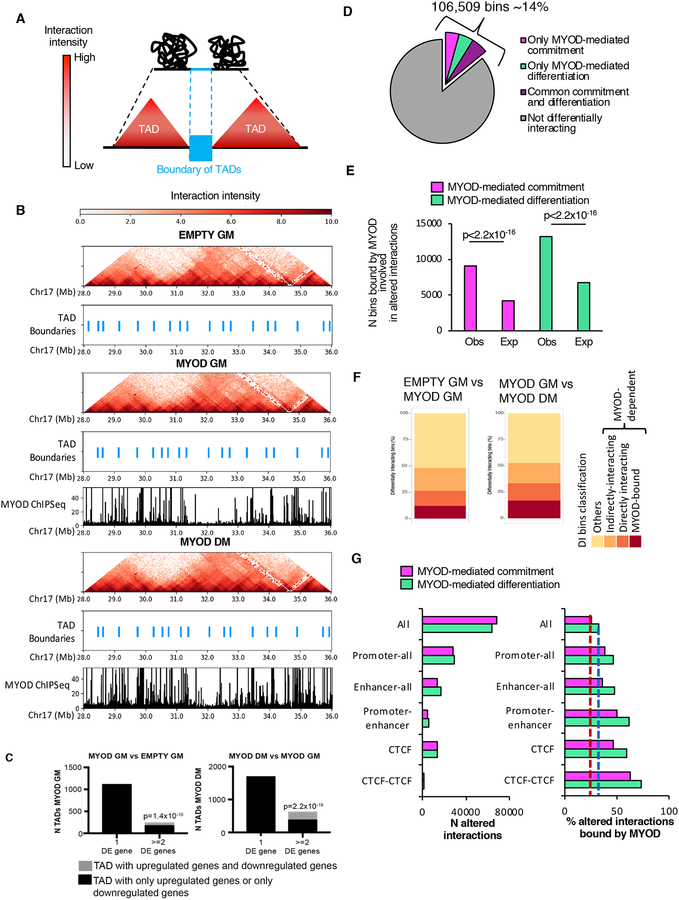
Figure 2: Profound alteration of chromatin contacts by MYOD during myogenic conversion. See alsoFigures S2 andS3.
A, Graphical representation of TADs and TAD boundaries.
B, Hi-C interaction pattern (red heat map) and TAD boundaries (light blue) in EMPTY GM, MYOD GM and MYOD DM, MYOD ChIP-seq in MYOD GM and MYOD DM (black).
C, Number of TADs with one or more DE genes. Black represents the TADs whose differentially expressed genes are all upregulated or all downregulated; gray represents the TADs containing upregulated genes and downregulated genes. LEFT: gene expression comparison between EMPTY GM and MYOD GM. TADs were identified in MYOD GM. RIGHT: gene expression comparison between MYOD GM and MYOD DM. TADs were identified in MYOD DM. pvalue represents the significant prevalence of TADs with two or more differentially expressed genes that were either all upregulated or all downregulated compared to TADs that have both upregulated genes and downregulated genes. pvalue was calculated using the two-sided exact binomial test.
D, Percentage of 4kb bins involved in at least one differential interaction only during MYOD-mediated commitment (magenta), only during MYOD-mediated differentiation (green), or at both stages (violet).
E, Number (N) of bins involved in altered chromatin interactions during MYOD-mediated commitment (magenta) or differentiation (green) observed or expected to be bound by MYOD. Expected bin number was calculated based on the number of bins bound by MYOD genome-wide. Chi-squared test was used for statistical analysis.
F, Percentage of DI bins bound by MYOD (red), DI bins directly interacting with MYOD-bound bins (orange), DI bins indirectly interacting (dark yellow), others (yellow) – see figure S3A for details
G, Left: number (N) of differential interactions, including all differential interactions (All) Promoters-all (interactions between promoters and any other genomic region), Enhancers-all (interactions between enhancers and any other genomic region), Promoter-enhancers and CTCF-bound regions during MYOD-mediated commitment (magenta) or differentiation (green). Right: percentage of the differential interactions described on the left that were bound by MYOD during myogenic commitment (magenta) or differentiation (green) (right). Dashed lines represent the percentage of all differential interactions bound by MYOD during commitment (red) or differentiation (blue).

