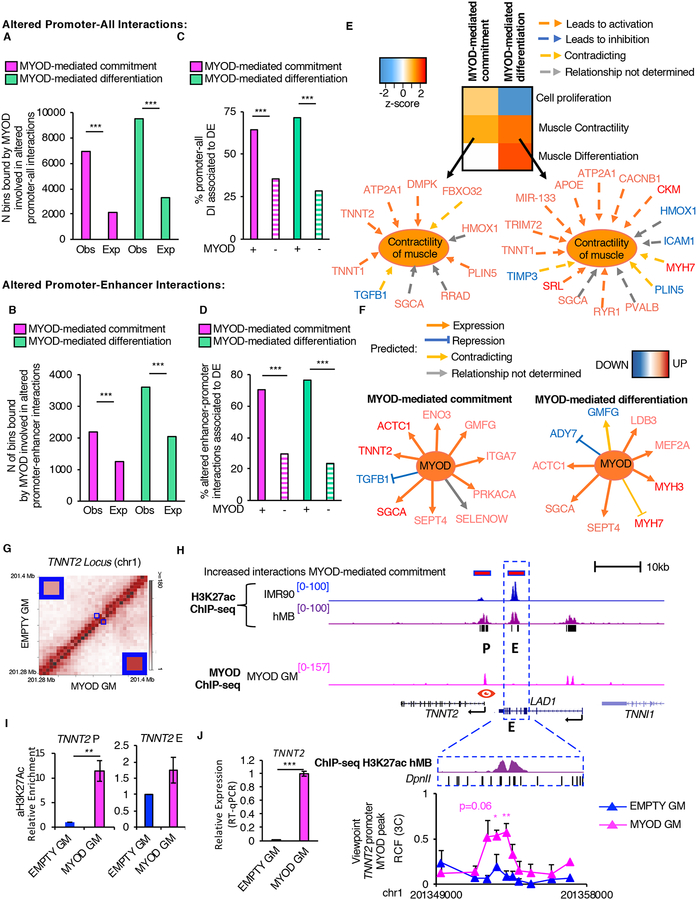
Figure 3: Characterization of MYOD-altered cis-regulatory interactions.
A, Number (N) of MYOD-bound bins involved in altered interactions between promoters and other genomic elements during myogenic commitment (magenta) or differentiation (green). The expected number of MYOD-bound bins was calculated based on MYOD-binding genome-wide (see methods).
B, Number (N) of MYOD-bound bins involved in altered enhancer-promoter interactions during commitment (magenta) or differentiation (green). The expected number of MYOD-bound bins was calculated based on MYOD-binding to enhancer or promoter (see methods).
C,D, Percentage (%) of MYOD-bound or unbound (dashed) differential interactions between promoters of DE genes and (C) other genomic elements or (D) enhancers.
E, Heatmap representing biological functions (using IPA) activated (orange) or inhibited (blue) based on DE genes, whose promoters are involved in MYOD-bound differential interactions during commitment or differentiation.
F, DE genes, whose promoters are involved in MYOD-bound differential interactions with enhancers during commitment or differentiation. Analysis performed using IPA.
G, Normalized contact heatmap at TNNT2 locus in EMPTY GM (top left) or MYOD GM (bottom right). The region in blue box corresponds to TNNT2 enhancer-promoter interaction. Enlargement of the interaction of interest in the corners.
H, From top to bottom: Magenta bars represent bins whose interaction increased during MYOD-mediated commitment determined by Hi-C. UCSC snapshots of: H3K27ac ChIP-seq in IMR90 (blue), hMB (violet), P indicates the TNNT2 promoter, E represents an enhancer, MYOD ChIP-seq in MYOD GM (magenta), RefSeq genes, black bars represent regions with increased H3K27ac levels in hMBs compared to IMR90. Close up representation of the enhancer region in the dashed blue box H3K27ac ChIP-seq in hMB (violet), and DpnII sites. Relative crosslinking frequencies (RCF) by in situ 3C using as view point MYOD peak at TNNT2 promoter (red eye) (n=3).
I, Relative enrichment of H3K27ac by ChIP-qPCR at TNNT2 promoter and enhancer, n=3. Data is represented as mean +/− SEM.
J, Relative mRNA expression of TNNT2 (n=3).
In A–D chi-squared test was used for statistical analysis, *** p<2.2×10⁻¹⁶
In H–J data is represented as mean + SEM. T-test was used for statistical analysis, * p<0.05, ** p<0.01.

