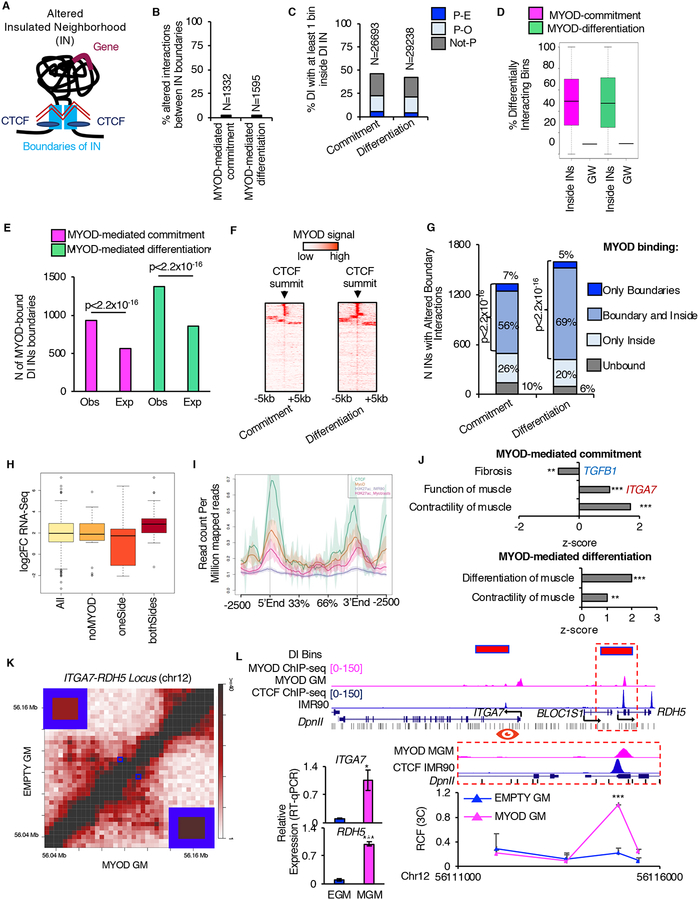
Figure 4: MYOD alters insulated neighborhoods to regulate myogenesis. See alsoFigures S4 andS5 andTables S2 andS3.
A, Graphical representation of altered IN: black line represents the DNA, light-blue boxes represent IN boundaries, blue ovals represent CTCF, violet line represent gene, zig-zagged red lines represent altered interaction.
B, Percentage (%) and number (N) of differential interactions corresponding to altered IN boundary interactions.
C, Percentage (%) and number (N) of DIs with at least one bin that mapped inside altered INs during myogenic commitment or differentiation.
D, Percentage of DI bins genome-wide (GW) and distribution of percentages of DI bins inside altered INs.
E, Number (N) of IN boundaries which differentially interacted during myogenic commitment (magenta) or differentiation (green) that were observed (Obs) or expected (Exp) to be bound by MYOD. Expected number of MYOD-bound IN boundaries was calculated based on MYOD binding at bins containing CTCF genome-wide (see Methods). For statistical analysis Chi-squared test was used.
F, MYOD ChIP-seq signal over CTCF-summit +/−5kb at IN boundaries which differentially interacted during myogenic commitment or differentiation.
G, MYOD binding distribution at altered INs. For statistical analysis Chi-squared test was used.
H, Boxplots of the gene expression changes EMPTY GM vs MYOD GM of DE genes (p<0.01) in DI INs with strengthen interaction between boundaries (All); among these, DI INs not bound by MYOD at the boundaries (noMYOD), at only one boundary (oneSide), and at both boundaries (bothSides).
I, NGSplot of CTCF, MYOD and H3K27ac signal ChIP-seq from IMR90 (CTCF, H3K27ac EMPTY GM) and myoblast (MYOD, H3K27ac_myoblast). 167 regions
J, IPA-based GO analysis of the DE genes within MYOD-bound altered INs.
K, Normalized contact heatmap for EMPTY GM (top left) and MYOD GM (bottom right) at ITGA7-RDH5 locus. Interaction under investigation is highlighted by blue boxes. Magnification of the blue boxes is shown in the corners.
L, From top to bottom: Magenta bars represent bins whose interaction increased during MYOD-mediated commitment. UCSC snapshots of: MYOD ChIP-seq in MYOD GM (magenta) and CTCF in IMR90 (blue), RefSeq genes from UCSC browser, DpnII sites (black). Close up representation of the region in the dashed red box. Relative crosslinking frequencies (RCF) by in situ 3C using as view point MYOD-CTCF peak at ITGA7 promoter (red eye) (n=3). 3C data is represented as mean + SEM. Relative mRNA expression of ITGA7 and RDH5 (n=3). Data is represented as mean +/− SEM. T-test was used for statistical analysis, * p<0.05, ** p<0.01, *** p<0.001.

