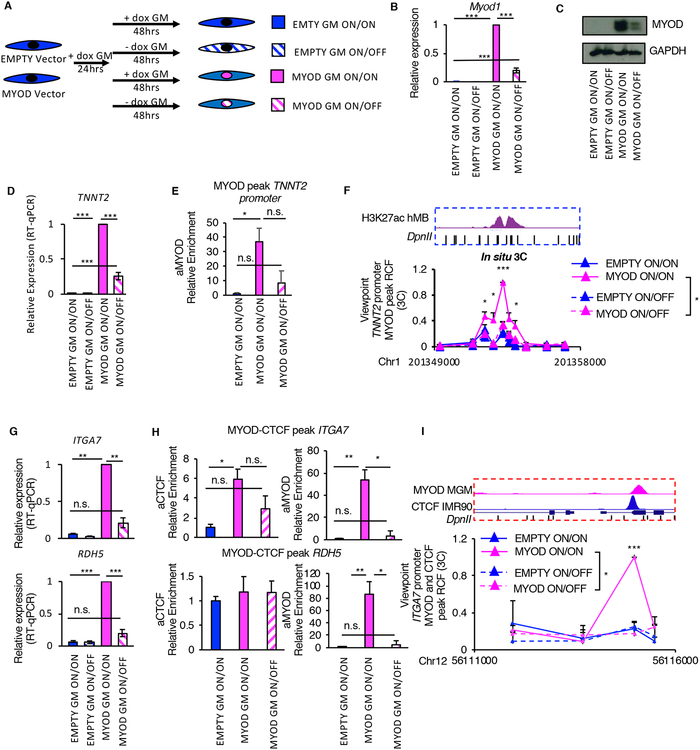
Figure 5: MYOD expression is necessary for the maintenance of MYOD-regulated chromatin interactions. See alsoFigures S6 andS7.
A, Scheme of the experimental approach used for all experiment in Fig. 5, EMPTY or MYOD IMR90 were exposed to doxycycline for 24h in GM followed by additional 48h of with/out doxycycline (ON/ON, ON/OFF).
B, Relative mRNA expression of Myod1 compared to EMPTY ON/ON (n=3). Data is represented as mean +/− SEM.
C, Immunoblot analysis of the whole cell lysate. GAPDH is used as loading control
D, Relative mRNA expression of TNNT2 compared to EMPTY ON/ON (n=3). Data is represented as mean +/− SEM
E, ChIP-qPCR for MYOD at TNNT2 promoter relative to EMPTY ON/ON (n=3).
F, Relative crosslink frequency (RCF) values between MYOD peak at TNNT2 promoter (view point – red eye – see Fig. 3H) and the enhancer. Data is represented as mean + SEM (n=3).
G, Relative mRNA expression of ITGA7 and RDH5 compared to EMPTY ON/ON (n=3). Data is represented as mean +/− SEM
H, ChIPqPCR for CTCF and MYOD at regulatory elements in the locus relative to EMPTY ON/ON (n=3).
I, Relative crosslink frequency (RCF) values between CTCF MYOD peak at ITGA7 promoter (view point – red eye – see Fig. 4L) and the CTCF MYOD peak in RDH5. Data is represented as mean + SEM (n=3).
T-test was used for statistical analysis, * p<0.05, ** p<0.01, *** p<0.001

