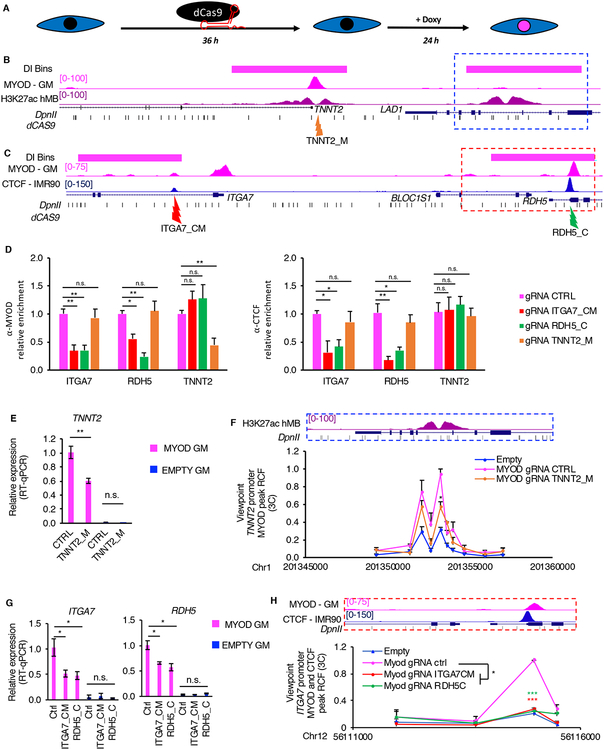
Figure 6: Direct MYOD binding is required for MYOD-directed changes in the 3D chromatin structure.
A, Scheme of the experimental approach used for all experiments in Fig. 6, EMPTY or MYOD IMR90 were transfected with plasmid encoding dCAS9 and specific gRNAs 36hours, then cells were treated with doxycycline for 24h in GM.
B, From top to bottom: TNNT2 locus - magenta bars represent bins whose interaction increased during MYOD-mediated commitment, UCSC genome browser snapshots of MYOD ChIP-seq in MYOD GM (magenta), H3K27ac ChIP-seq in hMB (violet), RefSeq genes, DpnII sites (black). Orange arrow indicates the region targeted by the gRNAs, which is MYOD and CTCF peak at TNNT2 promoter (TNNT2_M).
C, From top to bottom: ITGA7-RDH5 locus - magenta bars represent bins with increased interaction between during MYOD-mediated commitment, UCSC genome browser snapshots of MYOD ChIP-seq in MYOD GM (magenta), CTCF ChIP-seq in IMR90 (blue), RefSeq genes, DpnII sites (black). Red arrow indicates gRNAs targeting the MYOD-CTCF in the ITGA7 promoter (ITGA7_CM), green arrow indicates gRNAs targeting the CTCF in the RDH5 promoter (RDH5_C).
D, ChIP-qPCR for MYOD (left) or CTCF (right) at regulatory elements in ITGA7, RDH5 or TNNT2 loci. Data is represented as relative enrichment over MYOD expressing IMR90 transfected with CTRL gRNAs (n=3) Data is represented as mean + SEM.
E, Relative mRNA expression of TNNT2. Data is represented as mean +/− SEM
F, Close up representation of the enhancer region in the dashed blue box H3K27ac ChIP-seq in hMB (violet), and DpnII sites. Relative crosslinking frequencies (RCF) by in situ 3C using as view point MYOD peak at TNNT2 promoter (red eye, see Fig 3H) (n=3). 3C data is represented as mean + SEM.
G, Relative mRNA expression of ITGA7 and RDH5. Data is represented as mean +/− SEM
H, Close up representation of the enhancer region in the dashed red box MYOD ChIP-seq in MYOD GM (magenta), CTCF ChIP-seq in IMR90 (blue) and DpnII sites. Relative crosslinking frequencies (RCF) by in situ 3C using as view point CTCF-MYOD peak at ITGA7 promoter (red eye, see Fig 4L) (n=3). 3C data is represented as mean + SEM. T-test was used for statistical analysis, * p<0.05, ** p<0.01, *** p<0.001.

