Fig. 3.

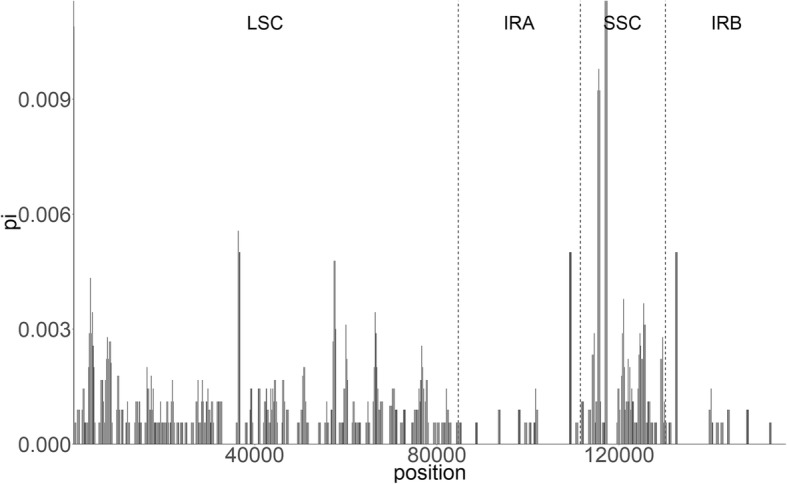
Plot of sliding window analysis on the whole chloroplast genome for nucleotide diversity (pi) compared among six Hosta species in Korea. The dashed lines are the borders of LSC, SSC and IR regions

Plot of sliding window analysis on the whole chloroplast genome for nucleotide diversity (pi) compared among six Hosta species in Korea. The dashed lines are the borders of LSC, SSC and IR regions