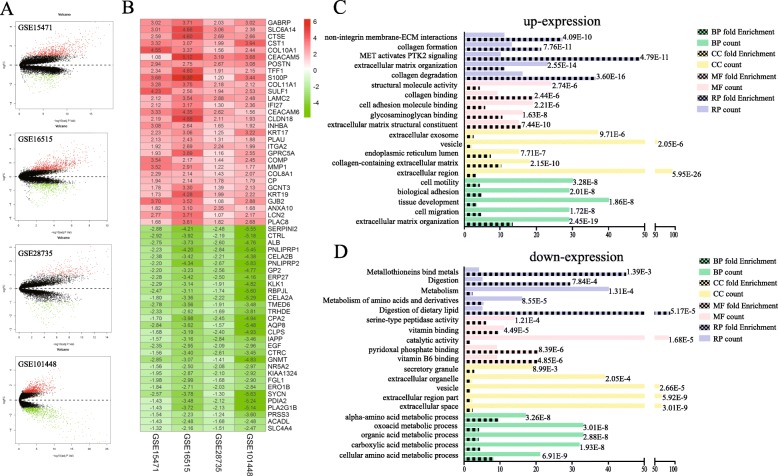
Fig. 2.
Identification of differentially expressed genes and their enrichment analysis. a The volcano plots of gene chips. b Heatmap displayed the log2(Fold change) of top 30 high expression genes and 30 low expression genes selected by Robust Rank Aggreg (RRA) methods from 4 independent gene chips. Each row represented the same mRNA from different gene chips and each column represented the same chip. The log2(Fold change) tendency of each mRNA was displayed in shade of red or green and the values of log2(Fold change) were marked within each box. Red represented the fold change of up-expressed genes and green represented down-expressed genes, respectively, compared to para-carcinoma tissues. c-d Gene ontology (GO) enrichment analysis and Reactome pathway enrichment analysis of high expression genes (c) and low expression genes (d). The vertical axis represented GO term or pathway, and the horizontal axis represented count of genes or fold enrichment. The column with black patches represented fold enrichment. The value of false discovery rate was shown at the end of each column. BP, biological process; CC, cellular component; MF, molecular function; RP, Reactome pathway

