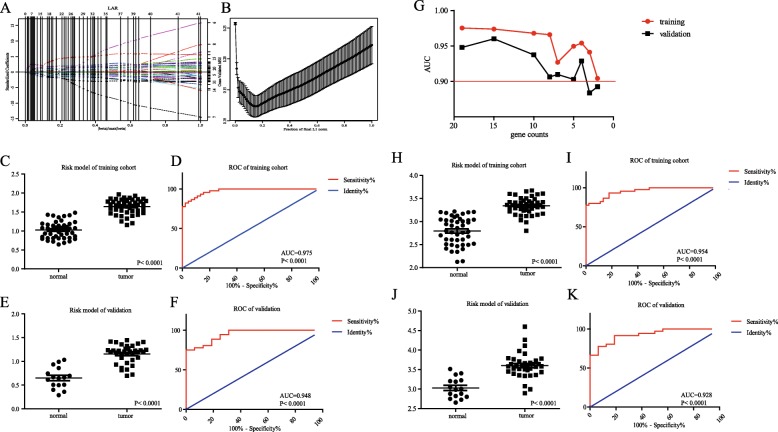
Fig. 5.
Construction of risk model for diagnosis of pancreatic carcinoma and ROC curve. a The solution paths of lasso regression model. The numbers on the right represented which variable each path corresponds to. Horizontal axis represented |beta|/max|beta| and vertical lines showed the event times for easy comparison between various solution paths. b The relationship between cross-validated mean square error (CV MSE) and model size. Horizontal axis represented fraction of final L1 norm, which referred to the ratio of the L1 norm of the coeffcient vector relative to the norm at the full least squares solution for the model with the maximum steps used. c The distribution of risk score of normal and tumor group of training set-GSE28735. d ROC curve of risk score for differentiating tumor from normal of training set. e The distribution of risk score of normal and tumor group of validation set-GSE16515. f ROC curve of risk model for differentiating tumor from normal of validation set. g The relation between gene counts that involve in diagnostic risk model and AUC of training cohort and validation cohort. h The distribution of risk score of normal and tumor group of training set-GSE28735 for simplified diagnostic risk model. i ROC curve of risk score for simplified diagnostic risk model of training set. j The distribution of risk score of normal and tumor group of validation set-GSE16515 for simplified diagnostic risk model. k ROC curve of risk score for simplified diagnostic risk model of validation set. AUC, area under the curve; ROC curve, Receiver operating characteristic curve

