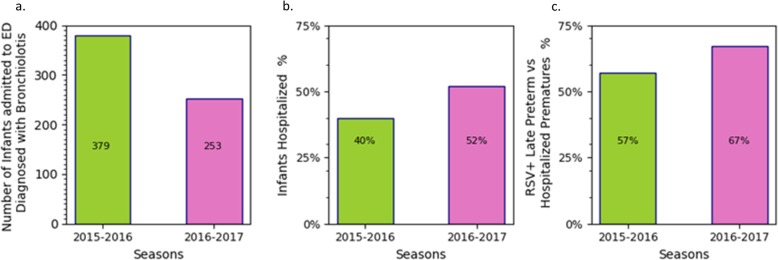
Fig. 3.
Histograms reporting for two consecutive seasons, 2015–2016 and 2016–2017, on the number of infants admitted to the ED, the infants hospitalized and late preterm infants with RSV. For the 2015–2016 and 2016–2017 seasons, (a) the number of infants admitted to the ED who are diagnosed with bronchiolitis, (b) the percentages of infants hospitalized for bronchiolitis relative to the number admitted to the ED, and (c) the percentages of preterm infants with RSV relative to the number of hospitalizations (379 and 253 as reported in panel a) for bronchiolitis in preterm infants. Refer to Table 2 for the absolute values from where such a percentage had been derived

