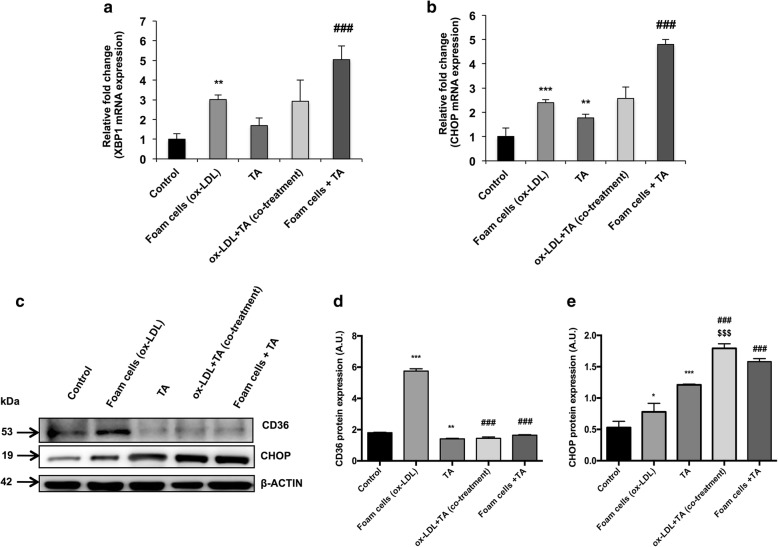
Fig. 4.
Effect of aqTAE on protein expression levels of CD36 and UPR-related markers in macrophages and foam cells. (a) and (b) Depicts mRNA levels of XBP1 and CHOP in the different groups. (c-e) Representative blots and quantification of protein levels of CD36 and CHOP normalized to the β-actin levels. Data expressed as mean ± S.D. of at least 3 independent experiments. *p< 0.05, **p < 0.01, ***p < 0.001 vs. control group, ###p < 0.001 vs. ox-LDL group, $$$p < 0.05 vs. TA alone

