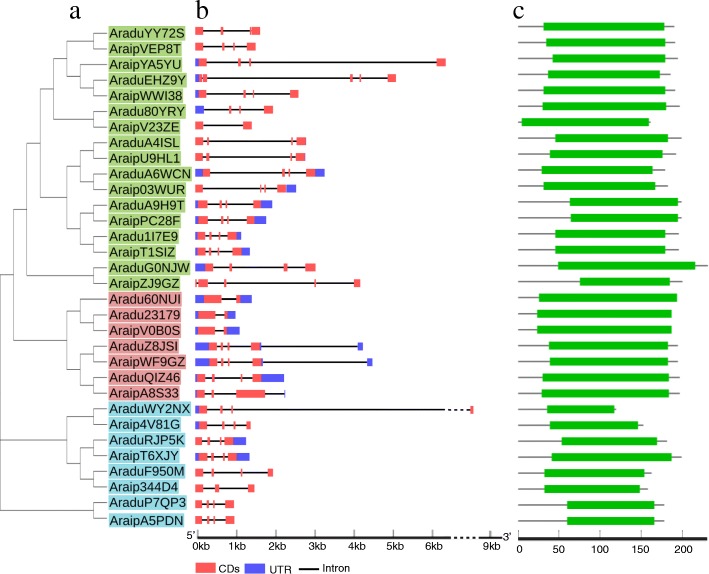
Fig. 3.
Phylogenetic and structure analysis of PEBP genes from two wild peanut species. a Phylogenetic relationship analysis of wild peanut PEBP proteins. The green, pink, and light blue colors indicate TFL1-like, MFT-like, and FT-like sub-families, respectively. b The exon-intron organizations of PEBP genes. UTRs, exons, and introns are represented by dark blue, red, and black lines, respectively. c The green boxes indicate conserved PEBP domains in each of the different peanut PEBP proteins

