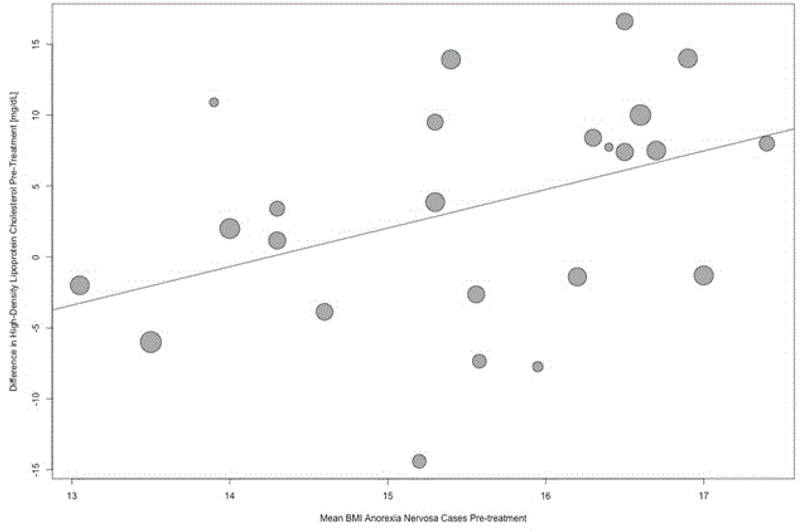
Figure 4.
Bubble plot. Meta-regression examining the association of the moderator BMI with the mean differences in high-density lipoprotein (HDL) cholesterol between acutely-ill individuals with anorexia nervosa and healthy control participants. Bubble size is inversely proportional to the variance of the estimated mean difference. This means bubbles are sized according to the precision of each estimate with larger bubble for more precise estimates.

