Fig. 2.
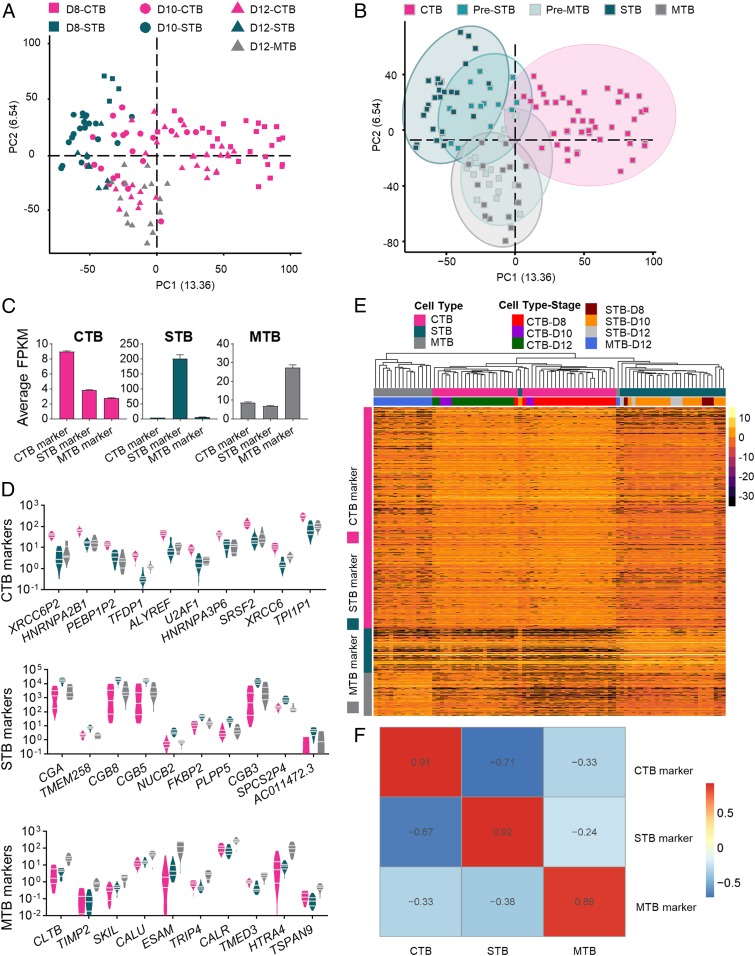
Identification of cell type specific markers for CTB, STB, and MTB. (A) PCA of trophoblast cells showing discrete clusters based on cell type. (B) PCA analysis reveals subsets of CTB that had partial STB and MTB signatures, classified as Pre-STB and Pre-MTB, respectively. (C) Average FPKM for CTB, STB, and MTB marker gene expression in each cell type. (D) Expression, based on least likelihood of false discovery of the top 10 marker genes for CTB, STB, and MTB in each cell type. (E) Hierarchical clustering analysis of cell type marker genes in trophoblast cells. These 3 panels of marker genes clearly partitioned each major TE cell type. Three panels of marker genes specifically for CTB, STB, and MTB are presented in the y axis, and cell types with different developmental stages are presented in the x axis. The color spectrum, ranging from yellow to black, indicates high to low normalized levels of gene expression. (F) Spearman correlation map indicating strong correlations between each cell type and their marker genes. The color spectrum, ranging from red to blue, indicates the correlation from high to low.

