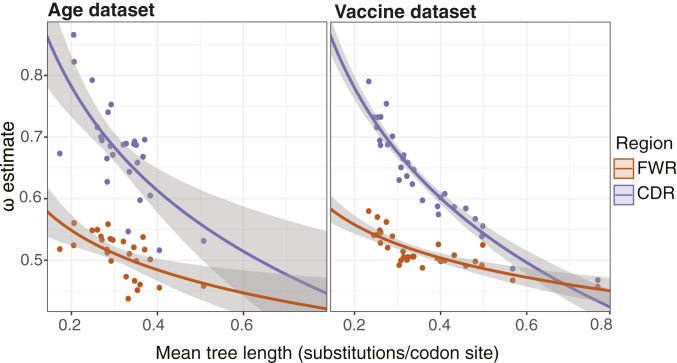
Fig. 5.
Negative relationship between ω and mean tree length. (Left) Linear regression between estimates of ωCDR (purple) and ωFWR (orange) and the natural log of mean tree length for each subject in the Age dataset. The slope and intercept of ωCDR against ln(mean tree length) were −0.24 (95% CI = −0.35, −0.14) and 0.39, respectively (P < 6 × 10⁻⁵ for both). The corresponding slope and intercept of ωFWR were −0.09 (95% CI = −0.14, −0.04) and 0.4 (P < 0.002 for both). (Right) Linear regression between estimates of ωCDR (purple) and ωFWR (orange) and the natural log of mean tree length for each sample in the Vaccine dataset (3 subjects, 10 samples each). The slope and intercept of ωCDR against ln(mean tree length) were −0.26 (95% CI = −0.29, −0.23) and 0.36, respectively (P < 4 × 10⁻¹⁶ for both). The corresponding slope and intercept of ωFWR were −0.08 (95% CI = −0.1, −0.05) and 0.43 (P < 4 × 10⁻⁷ for both). Gray shaded areas in both panels show SE estimates of the log-linear regression.

